
Petroleum Devolopments
24
Volume
45
Issue
3
In January 2019, US tight oil production increased by 102 thousand b/d or 1.3%
comparing with the previous month level to reach 8 million b/d, representing an increase of
1.7 million b/d from their last year level. The US oil rig count decreased by 1 rig comparing
with the previous month level to reach 952 rig, a level that is 132 rig higher than last year,
as shown in
table (3)
and
figure (7)
:
Source: EIA, Drilling Productivity Report for key tight oil and shale gas regions, February 2019.
* focusing on the six most prolific areas, which are located in the Lower 48 states. These six regions accounted for 92% of
domestic oil production growth during 2011-2014, Bakken, Eagle Ford, Haynesville, Niobrara, Permian, Appalachia (Utica
and Marcellus), in addition to Anadarko region which become the target of many producers in the recent years, as of July
2017, there are 129 operating rigs in the Anadarko region.
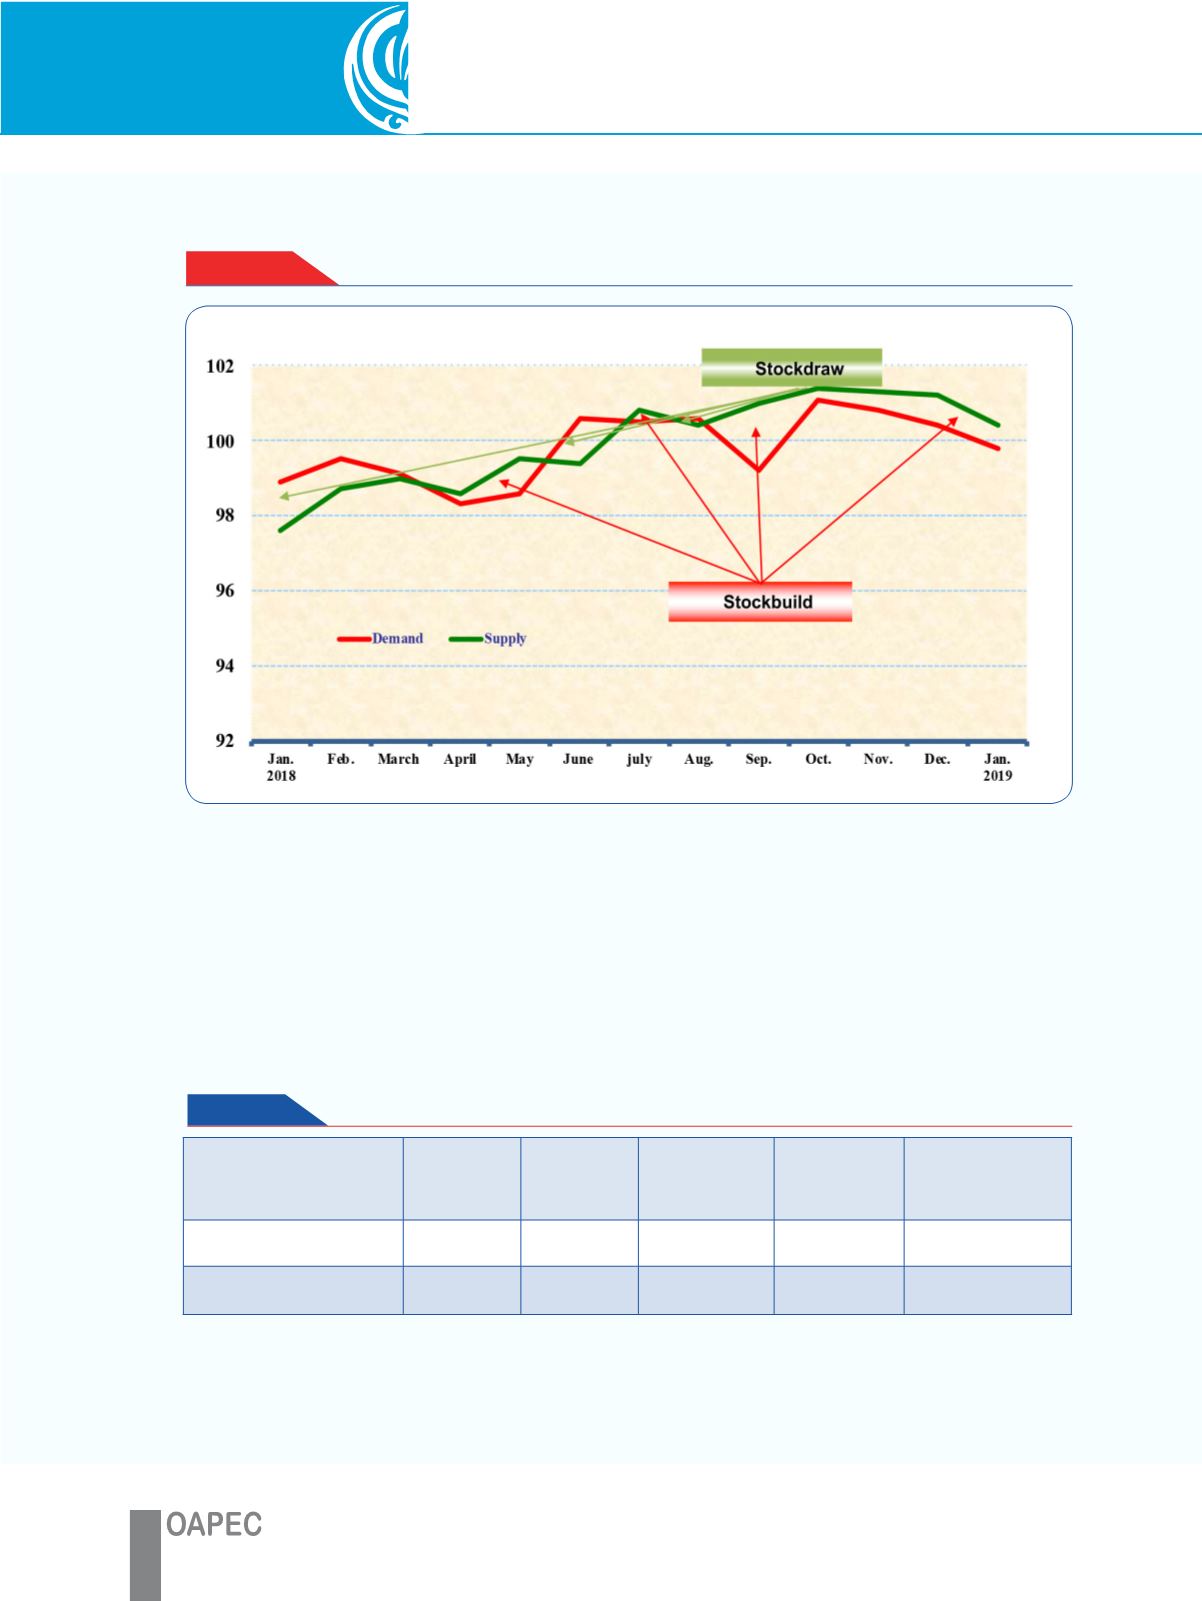
Figure - 6
World Oil Supply and Demand
(Million b/d)
Table 3
US tight oil production*
(Million b/d)
January
2019
December
2018
Change from
December
2018
January
2018
Change from
January
2018
tight oil production
8.233 8.121 0.102
6.517
1.706
Oil rig count (rig)
952
953
)1(
820
132
US tight oil production
Tables (7)
and
(8)
in the annex show world oil demand and supply for the period
2017-2018.


