


 27 / 32

Volume
45
Issue
3
27
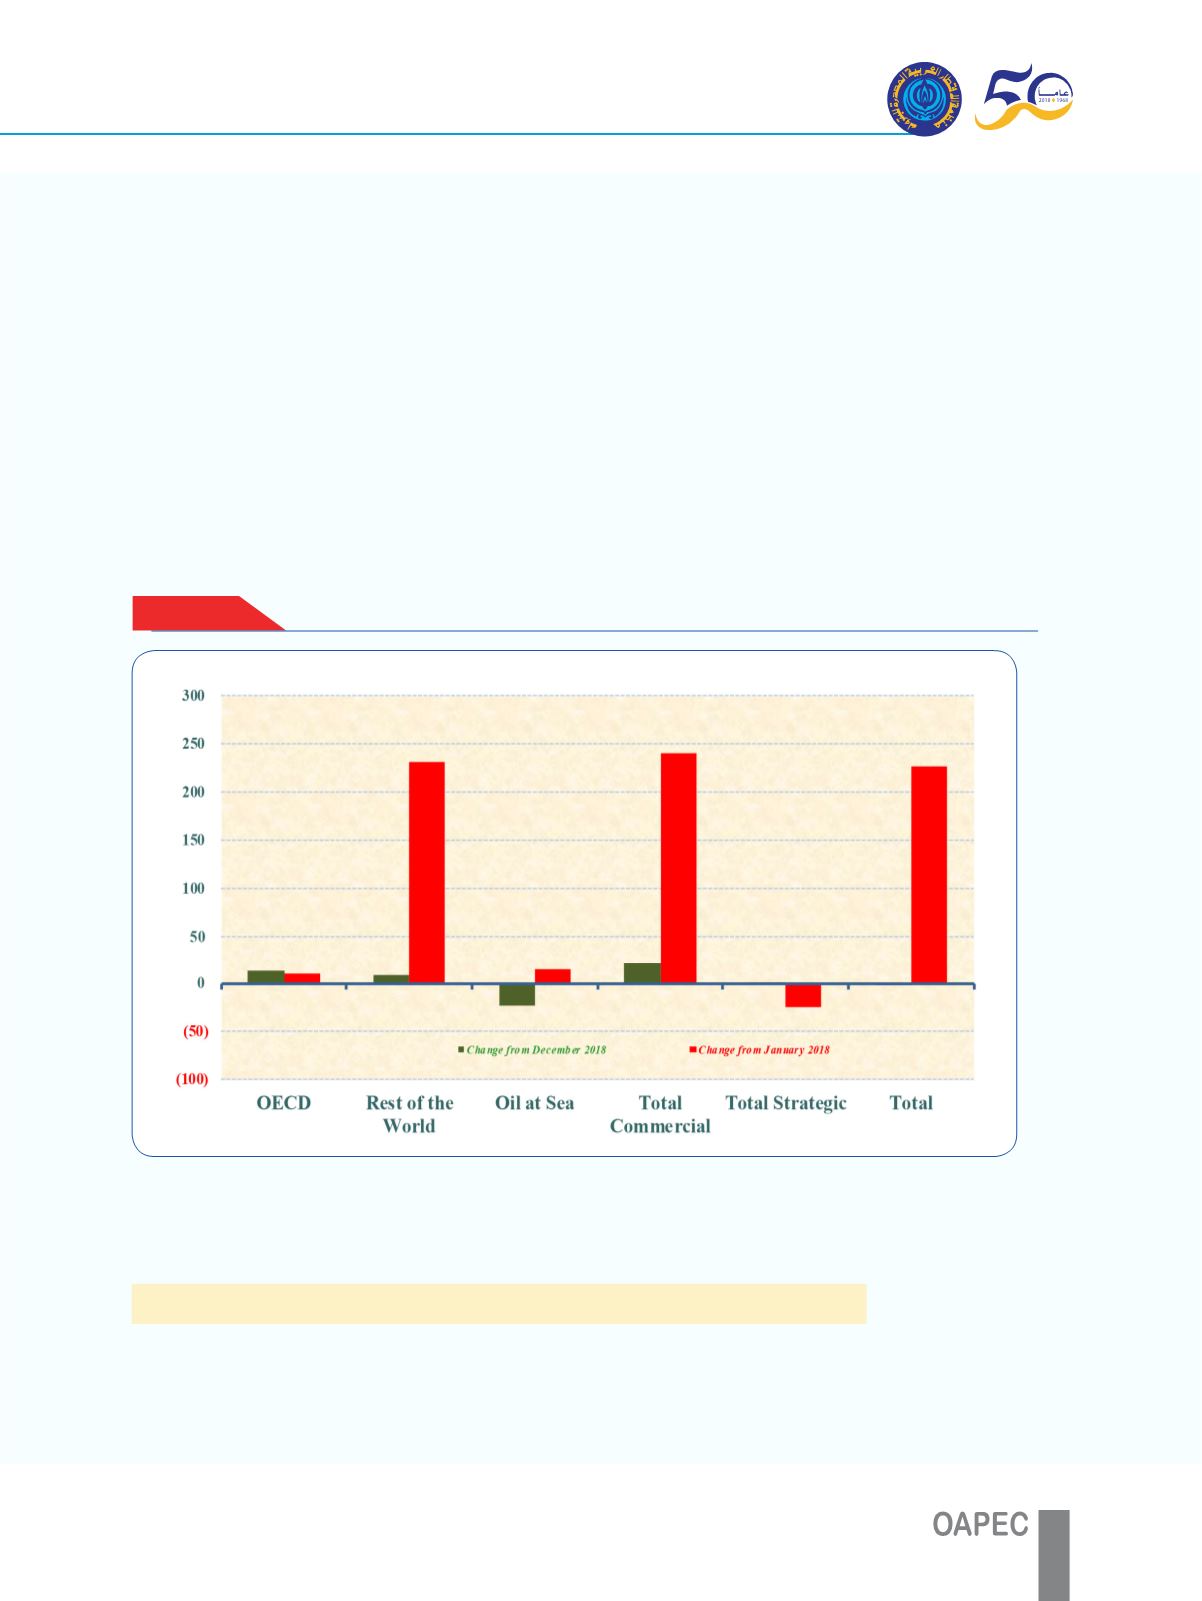
2957 million barrels, whereas the Inventories at sea decreased by 23 million barrels to reach
1186 million barrels.
As a result, Total Commercial oil inventories in January 2019 increased by 22 million
barrels to reach 5833 million barrels – a level that is 241 million barrels higher than a year
ago.
Strategic inventories in OECD-34, South Africa and China increased by 1 million barrels to
reach 1828 million barrels – a level that is 24 million barrels lower than a year ago
Total world inventories, at the end of January 2019 were at 8841 million barrels,
representing a decrease of 1 million barrels comparing with the previous month, and an
increase of 227 million barrels comparing with the same month a year ago.
Table (9)
in the annex and
figure (8)
show the changes in global inventories prevailing at
the end of January 2019.
Figure - 8
Changes in Global Inventories at the End of January 2019
(Million bbl)
II. The Natural Gas Market
1- Spot and Future Prices of Natural Gas in US market
The monthly average of spot natural gas price at the Henry Hub in January 2019
decreased by $0.9/ million BTU comparing with the previous month, to reach $3.11/
million BTU.