


 59 / 166

45
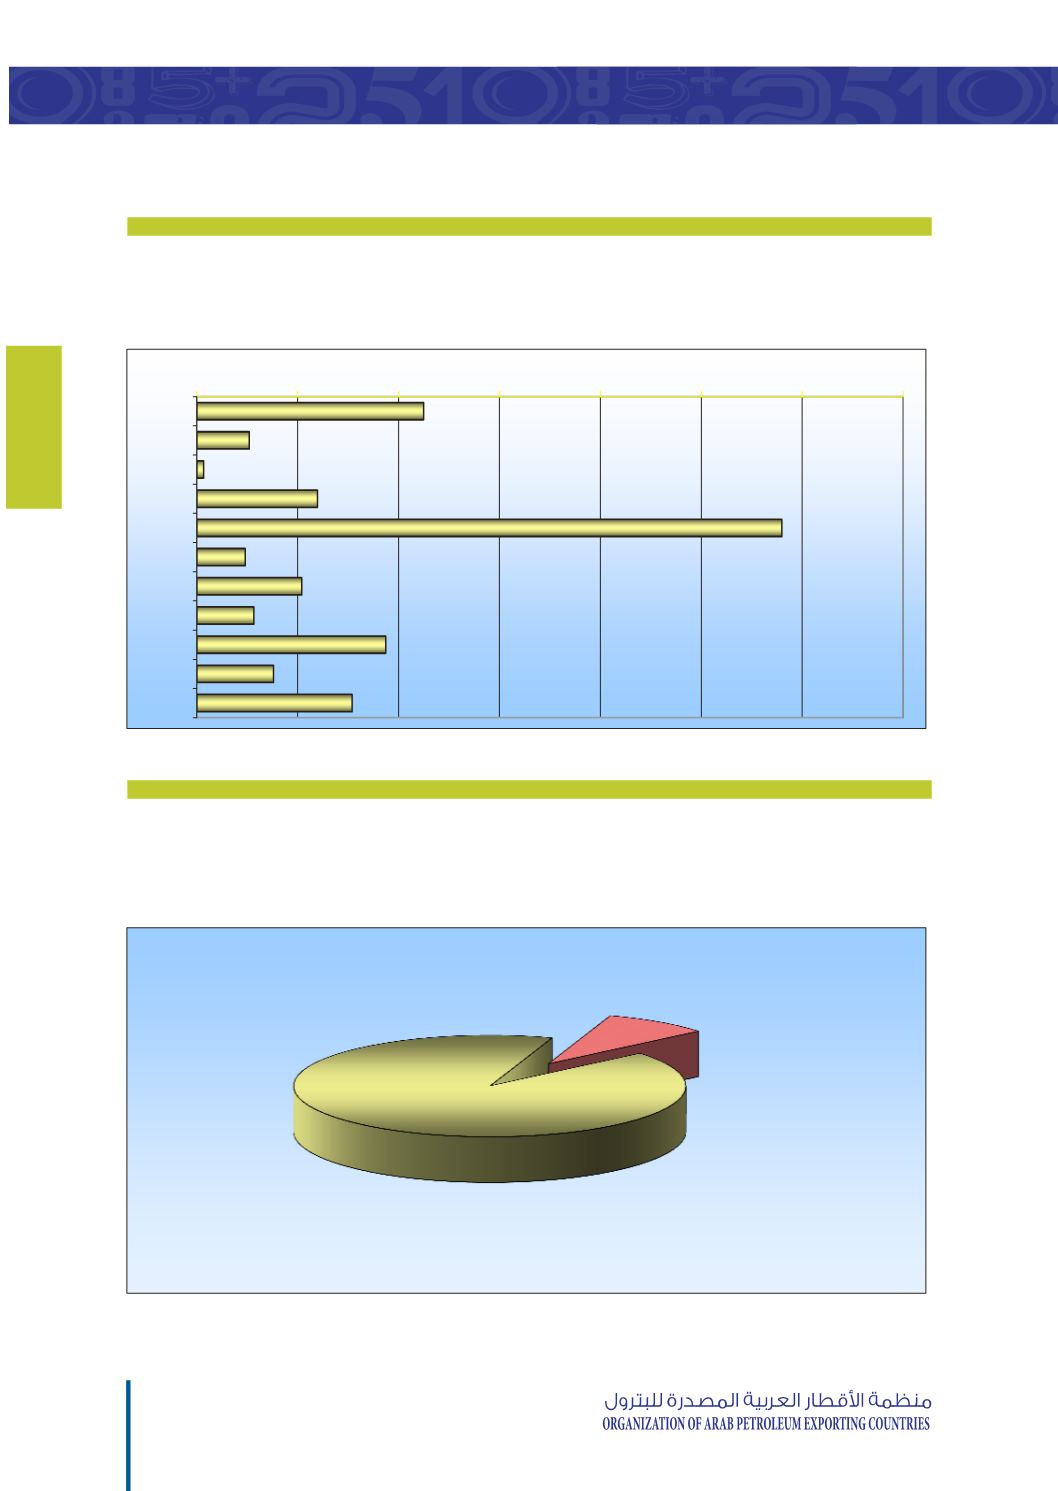
Installed Refining Capacity
Thousand b
/
d
Year 2015
صافي التكرير القائمة
�
طاقات م
ألف برميل / يوم
�
2015
عام
Installed Refining Capacity
)
%
(
Year 2015
صافي التكرير القائمة
�
طاقات م
)
%
(
2015
عام
Oman
222.0
222.0
222.0
222.0
222.0
عمان
Morocco
154.7
154.7
154.7
154.7
154.7
المغرب
Mauritania
25.0
25.0
25.0
25.0
25.0
موريحاويا
Yemen
140.0
140.0
140.0
140.0
140.0
اليمه
OAPEC
8044.1
7927.8
7528.7
7249.3
7254.3
أوابك
Other Arab Countries
772.1
772.1
772.1
772.1
772.1
الدول العربية الأخرى
Total Arab Countries
8816.2
8699.9
8300.8
8021.4
8026.4
اجمالي الدول العربية
Installed Refining Capacity
طاقات مصافي انتكرير انقائمة
Thousand b/d
أنف برميم
يوم /
Year 2015
عام
2015
Installed Refining Capacity
طاقات مصافي انتكرير انقائمة
(%)
(%)
Year 2015
عام
2015
0
500
1000
1500
2000
2500
3000
3500
UAE
Bahrain
Tunisia
Algeria
S.Arabia
Syria
Iraq
Qatar
Kuwait
Libya
Egypt
OAPEC
91.2%
Other Arab Countries
8.8%
44
Capacity
انقائمة
Capacity
انقائمة
500
1000
1500
2000
2500
3000
OAPEC
91.2%
Other Arab Countries
8.8%