151
CHAPTER TWO
Developments of Energy Resourrces
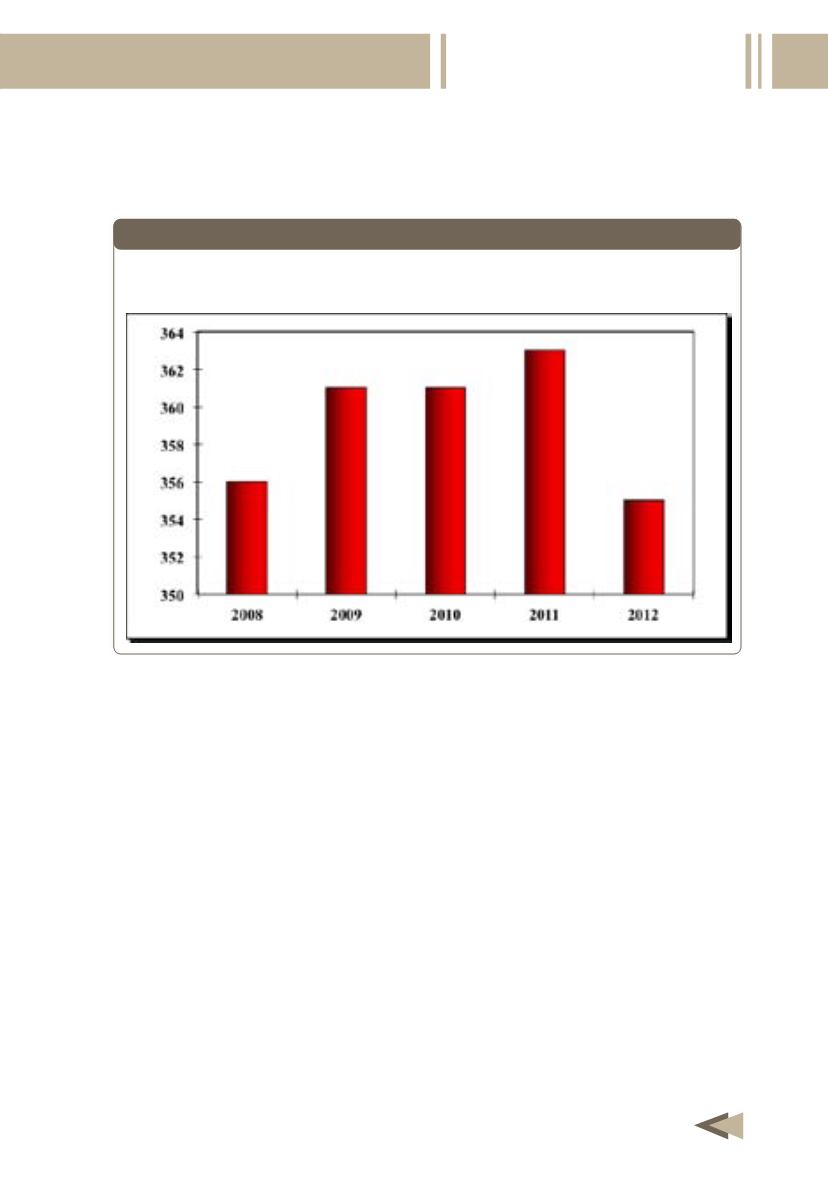
comparing the figures with Jan. 2011 where the number was 378-
crew/ month.
Figure (2-1)
and
Table (2-1)
.
* 2012 figures are for January only.
Figure 2-1
Seismic Surveying Activity in Different Parts of the World, 2008-2012*
(Crew/month)
1- 2 Exploration and Development Drilling:
Exploration drilling activities have considerably increase in some
area of the world in 2012. The number of rigs operating in the Middle
East increased by 22.3% from 292 rigs in 2011 to 351 rigs in 2012. The
number increased in Africa too by 20.5% from 78 rigs in 2011 to 95
rigs in 2012. Various regions of the world increased by more than 16%
comparing to 2010, to reach 3466 rigs. Europe recorded the highest
increase from 94 rigs in 2010 to 118 rigs in 2011. The number of rigs
operating in the US increased by 4.4% from 1875 in 2011 to 1943
in 2012, this could possibly be attributed to the increased gas prices
which encouraged drilling activities particularly in shale gas regions.


