Organization of Arab Petroleum Exporting Countries
Petroleum
Devolopments
Volume 40 Issue 5
33
Mar.
2013 Apr.
May Jun.
July Aug.
Sept.
Oct.
Nov.
Dec.
Jan.
2014 Feb.
Mar.
Natural Gas
(2)
4.0 4.2 4.0 3.9 3.6 3.4 3.6 3.7 3.6 4.2 3.3 5.8 3.8
WTI Crude
(3)
16.0 15.9 16.3 16.5 18.0 18.4 18.3 17.3 16.2 16.8 16.4 17.4 17.3
Low Sulfur
Fuel Oil (0..3%)
18.3 17.1 16.8 16.3 16.1 16.7 17.0 17.7 19.1 19.4 19.0 20.7 18.3
1. British Thermal Unit.
2. Henry Hub spot price.
3. WTI – West Texas Intermediate Crude oil price, in dollars per barrel, is converted to dollar per million BTU using a conversion factor
of 5.80 million BTU/bbl.
Source: World Gas Intelligence April 2, 2014.
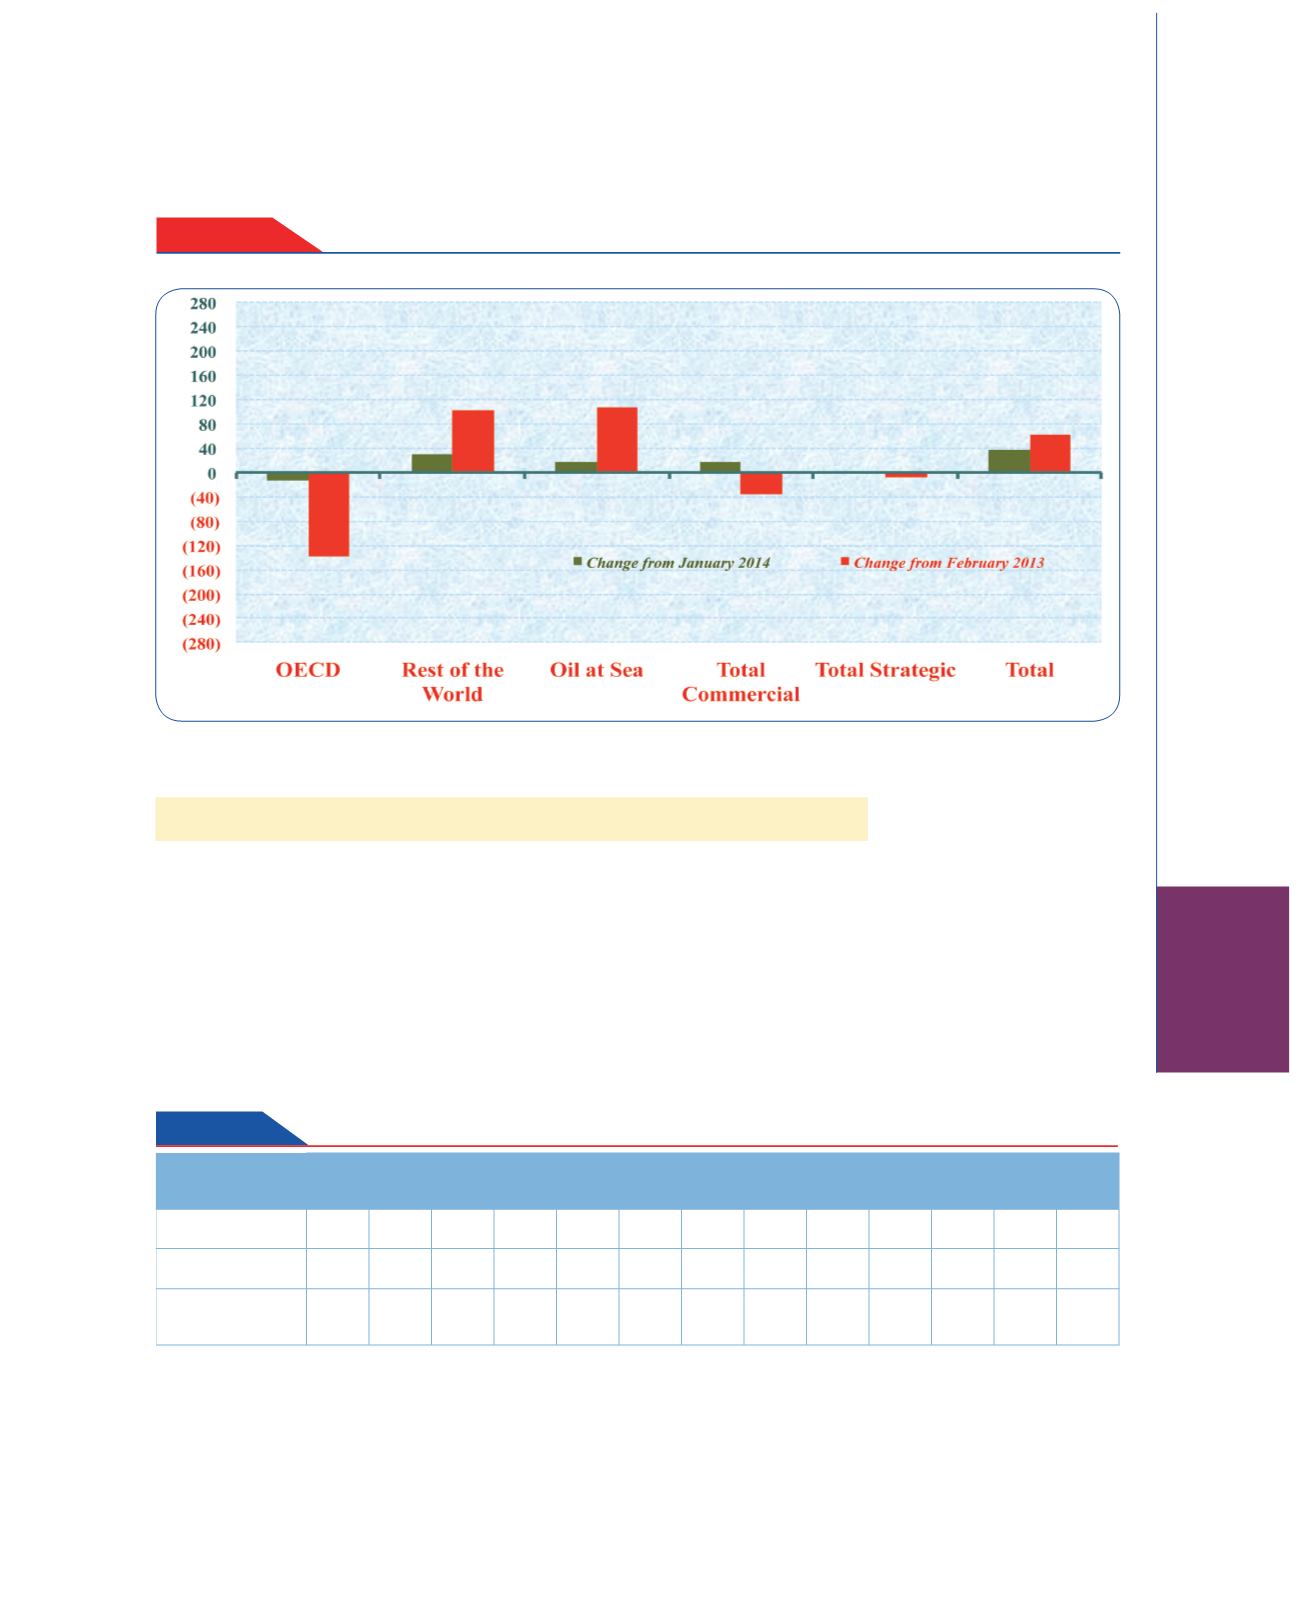
Figure - 7
Changes in Global Inventories at the End of February 2014
(Million bbl)
II. The Natural Gas Market
1- Spot and Future Prices of Natural Gas in US market
The monthly average of spot natural gas price at the Henry Hub in March
2014 decreased by $2.03/million BTU comparing with the previous month to
reach $3.79/ million BTU.
The comparison, shown in
table (4),
between natural gas prices and those
for the WTI crude and low sulfur fuel oil reveal differential of $13.5/ million
BTU in favor of WTI crude and $14.5/ million BTU in favor of low sulfur
fuel oil.
Table 4
Henry Hub Natural Gas, WTI Crude Average, and Low Sulfur Fuel Oil Spot Prices, 2013-2014
( Million BTU
1
)


