
95
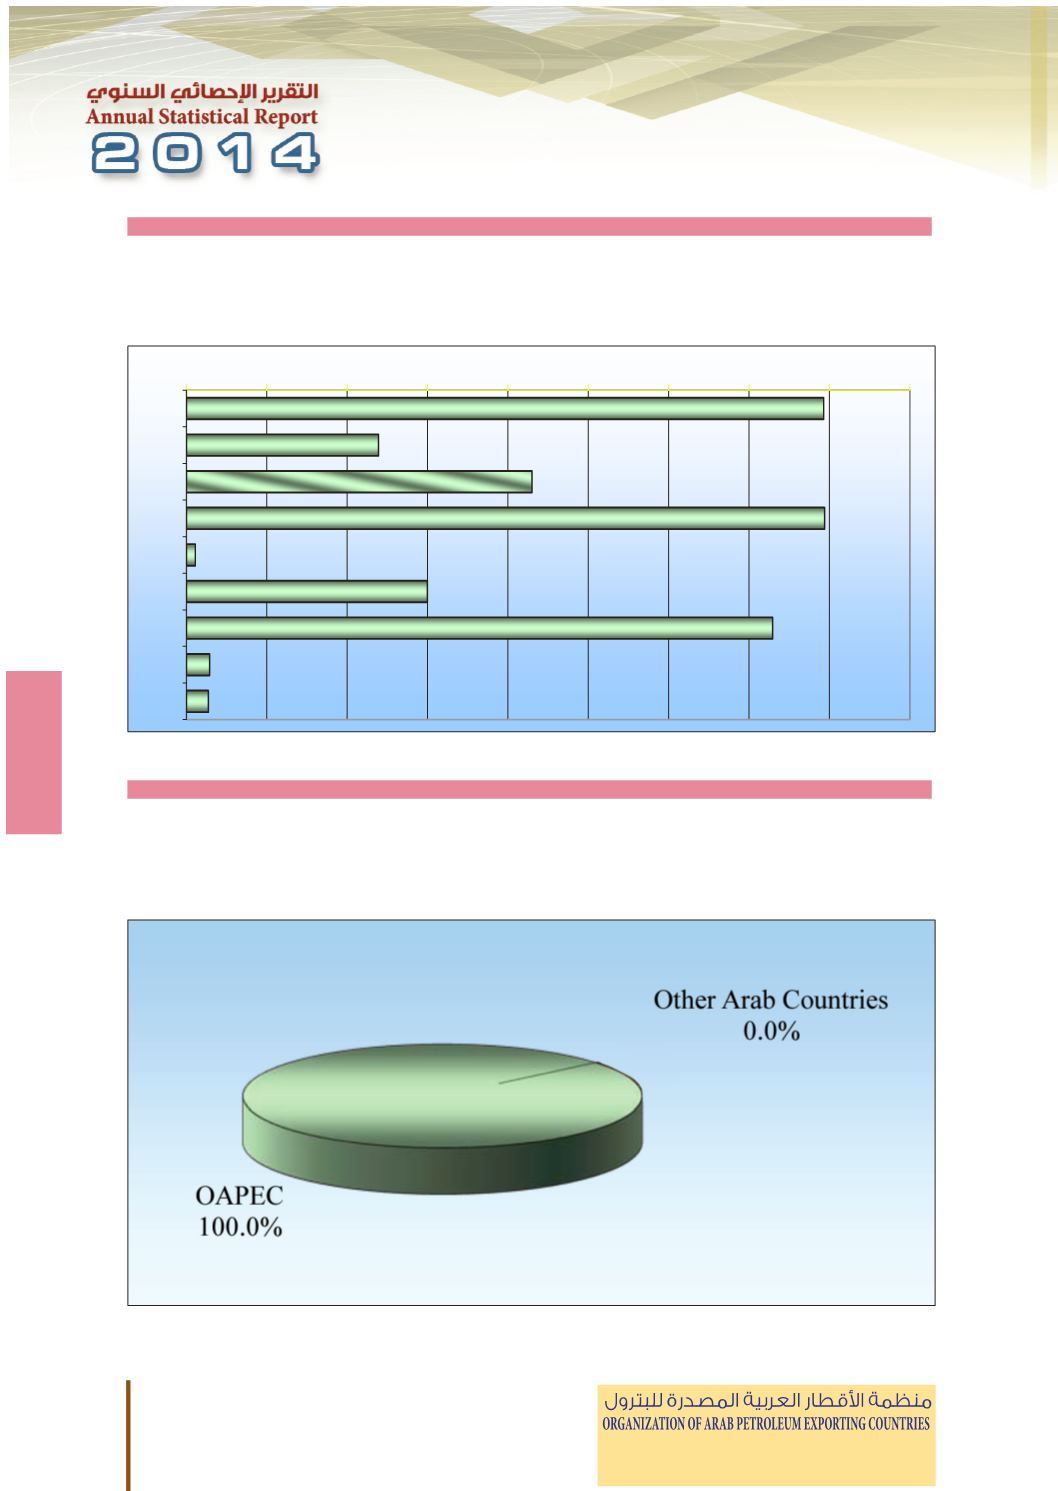
Oil Products Exports
Thousand b
/
d
Year 2013
شتقات النفطية
�
صادرات الم
�
ألف برميل / يوم
�
2013
عام
Oil Products Exports
)
%
(
Year 2013
شتقات النفطية
�
صادرات الم
�
)
%
(
2013
عام
94
Egypt
27.3
36.9
48.0
62.7
56.2
ήμϣ
Sudan
na
na
na
10.9
13.6
ϥΩϮδϟ
Oman
na
na
46.1
33.7
70.1
ϥΎϤϋ
OAPEC
3351.7
3356.5
3306.4
3306.5
3089.2
ϚΑϭ
Other Arab Countries
46.1
44.6
83.8
ϯήΧϷ ΔϴΑήόϟ ϝϭΪϟ
Total Arab Countries
3351.7
3356.5
3352.6
3351.1
3173.0
ΔϴΑήόϟ ϝϭΪϟ ϲϟΎϤΟ
Oil Products Exports
ΔϴτϔϨϟ ΕΎϘΘθϤϟ ΕέΩΎλ
Thousand b/d
ϡϮϳ
/
ϞϴϣήΑ ϒϟ
Year 2013
2013
ϡΎϋ
Oil Products Exports
ΔϴτϔϨϟ ΕΎϘΘθϤϟ ΕέΩΎλ
(%)
(%)
Year 2013
2013
ϡΎϋ
0
100
200
300
400
500
600
700
800
900
UAE
Bahrain
Algeria
S.Arabia
Iraq
Qatar
Kuwait
Libya
Egypt
OAPEC
100.0%
Other Arab Countries
0.0%


