
107
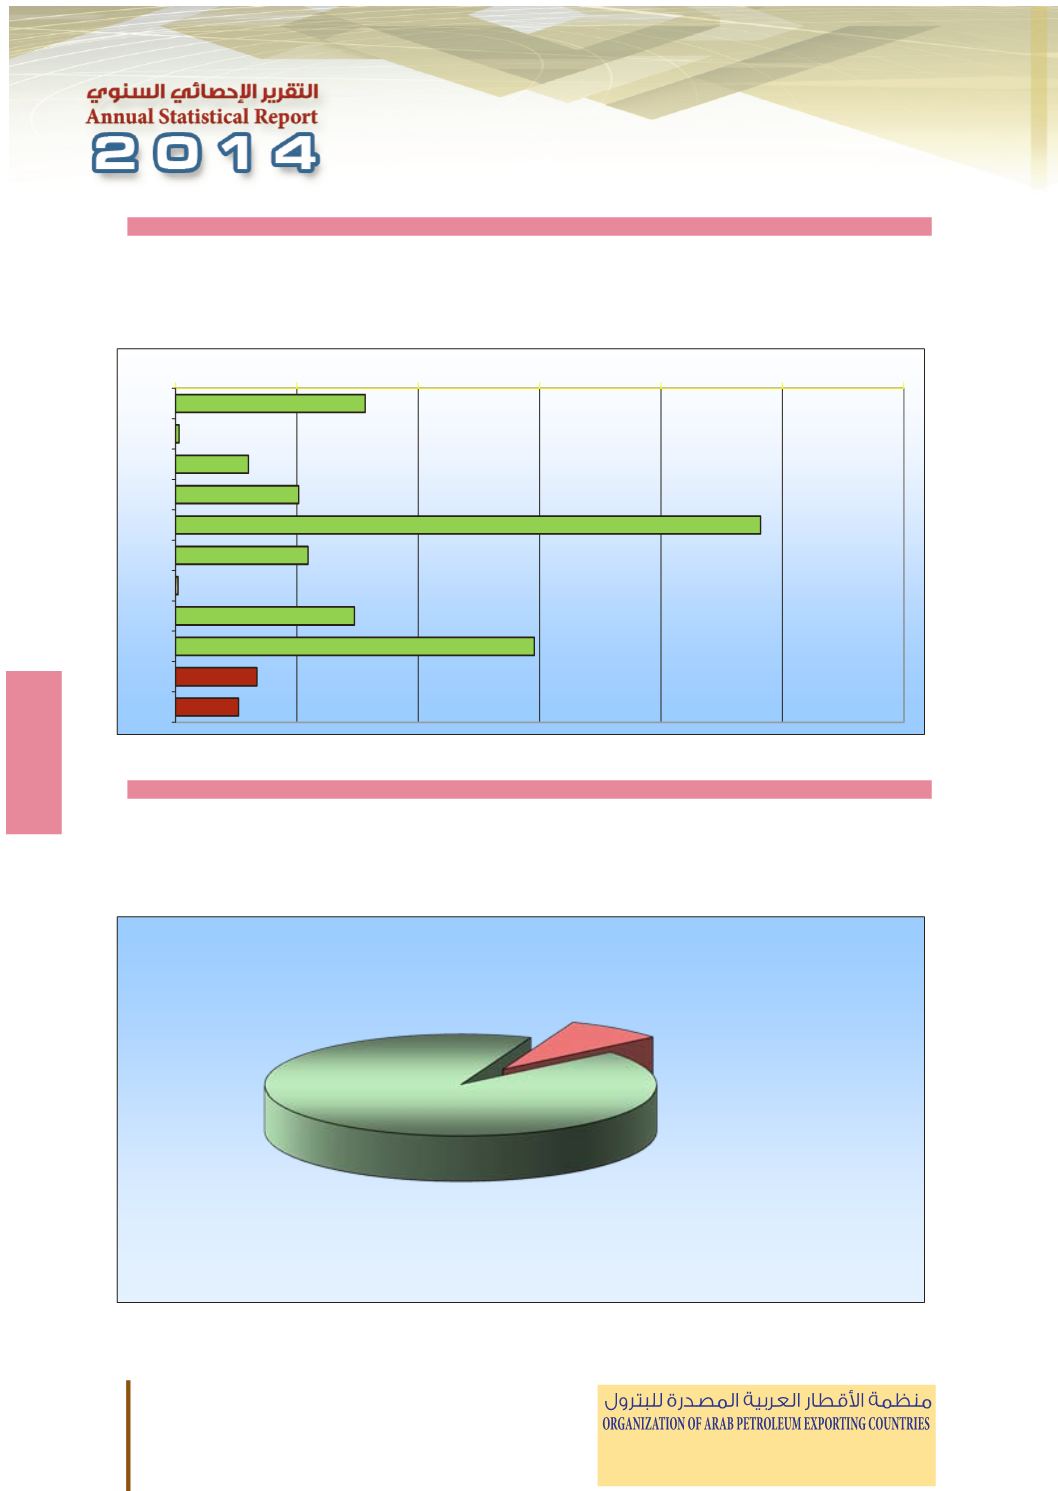
Oil Products Imports
Thousand b
/
d
Year 2013
شتقات النفطية
�
واردات الم
ألف برميل / يوم
�
2013
عام
Oil Products Imports
)
%
(
Year 2013
شتقات النفطية
�
واردات الم
)
%
(
2013
عام
106
Morocco
52.0
53.0
60.2
143.0
160.2
ΏήϐϤϟ
Mauritania
na
na
na
12.8
12.8
ΎϴϧΎΘϳέϮϣ
Yemen
na
na
na
59.1
60.7
ϦϤϴϟ
OAPEC
1356.8
1185.4
828.1
901.6
844.7
ϚΑϭ
Other Arab Countries
119.0
126.3
127.7
406.2
412.1
ϯήΧϷ ΔϴΑήόϟ ϝϭΪϟ
Total Arab Countries
1475.8
1311.7
955.8
1307.8
1256.8
ΔϴΑήόϟ ϝϭΪϟ ϲϟΎϤΟ
Oil Products Imports
ΔϴτϔϨϟ ΕΎϘΘθϤϟ ΕΩέϭ
Thousand b/d
ϡϮϳ
/
ϞϴϣήΑ ϒϟ
Year 2013
2013
ϡΎϋ
Oil Products Imports
ΔϴτϔϨϟ ΕΎϘΘθϤϟ ΕΩέϭ
(%)
(%)
Year 2013
2013
ϡΎϋ
0
100
200
300
400
500
600
UAE
Bahrain
Tunisia
Algeria
S.Arabia
Iraq
Qatar
Libya
Egypt
Jordan
Morocco
OAPEC
91.9%
Other Arab Countries
8.1%
106
100
200
300
400
500
OAPEC
91.9%
Other Arab Countries
8.1%


