
37
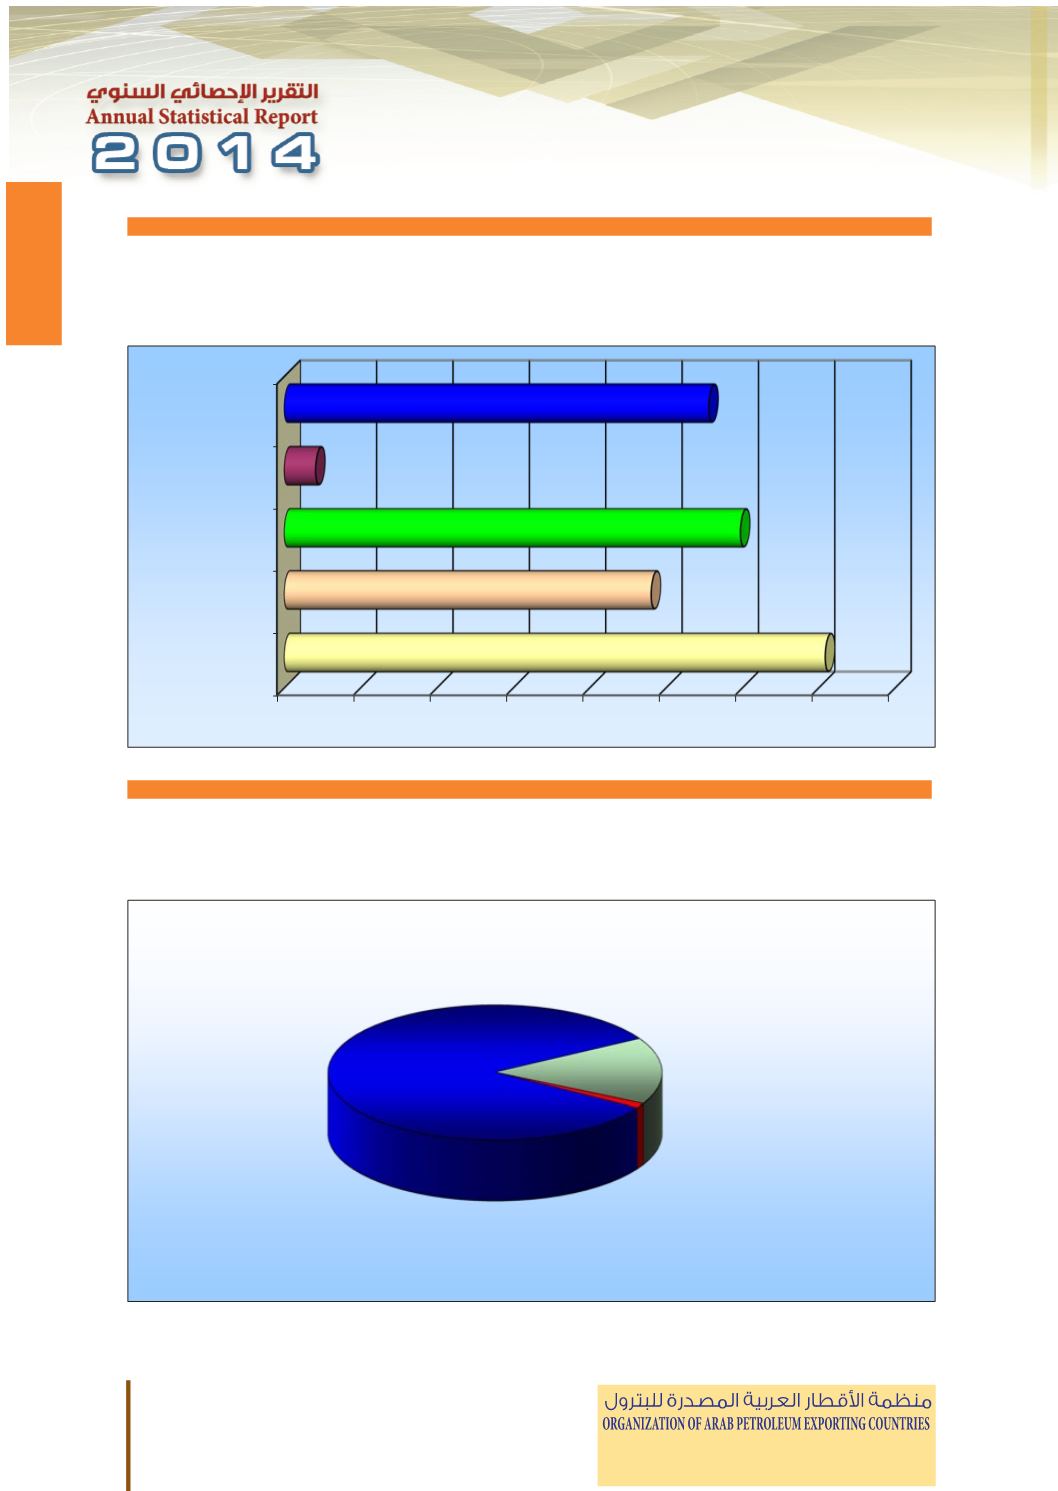
Marketed Natural Gas
Billion cubic meters
Year 2013
سوق
�
الغاز الطبيعي الم
مليار متر مكعب
2013
عام
Marketed Natural Gas
)
%
(
Year 2013
سوق
�
الغاز الطبيعي الم
)
%
(
2013
عام
36
OAPEC
16.0
16.3
16.0
16.2
14.9
ϚΑϭ
Other Arab Countries
1.2
1.1
1.1
1.0
0.8
ϯήΧϷ ΔϴΑήόϟ ϝϭΪϟ
Total Arab Countries
17.2
17.4
17.1
17.2
15.8
ΔϴΑήόϟ ϝϭΪϟ ϲϟΎϤΟ
Arab OPEC Countries
13.8
14.0
13.5
13.6
12.2
ΔϴΑήόϟ ϚΑϭ ϝϭΩ
OPEC
20.4
21.8
21.0
20.8
19.4
ϚΑϭ
Total World
100.0
100.0
100.0
100.0
100.0
ϢϟΎόϟ ϲϟΎϤΟ
Marketed Natural Gas
ϕϮδϤϟ ϲόϴΒτϟ ίΎϐϟ
Billion cubic meters
ΐόϜϣ ήΘϣ έΎϴϠϣ
Year 2013
2013
ϡΎϋ
Marketed Natural Gas
ϕϮδϤϟ ϲόϴΒτϟ ίΎϐϟ
(%)
(%)
Year 2013
2013
ϡΎϋ
0
100
200
300
400
500
600
700
800
OAPEC
Other Arab Countries
Total Arab Countries
Arab OPEC Countries
OPEC
OAPEC
16.0%
Other Arab Countries
1.2%
Rest of World
82.8%
36
Total Arab Countries
17.2
17.4
17.1
17.2
15.8
ΔϴΑήόϟ ϝϭΪϟ ϲϟΎϤΟ
Arab OPEC Countries
13.8
14.0
13.5
13.6
12.2
ΔϴΑήόϟ ϚΑϭ ϝϭΩ
OPEC
20.4
21.8
21.0
20.8
19.4
ϚΑϭ
Total World
100.0
100.0
100.0
100.0
100.0
ϢϟΎόϟ ϲϟΎϤΟ
Marketed Natural Gas
ϕϮδϤϟ ϲόϴΒτϟ ίΎϐϟ
Billion cubic meters
ΐόϜϣ ήΘϣ έΎϴϠϣ
Year 2013
2013
ϡΎϋ
Marketed Natural Gas
ϕϮδϤϟ ϲόϴΒτϟ ίΎϐϟ
(%)
(%)
Year 2013
2013
ϡΎϋ
0
100
200
300
400
500
600
700
800
OAPEC
Other Arab Countries
Total Arab Countries
t i
OPEC
OAPEC
16.0%
Other Arab Countries
1.2%
Rest of World
82.8%


