
59
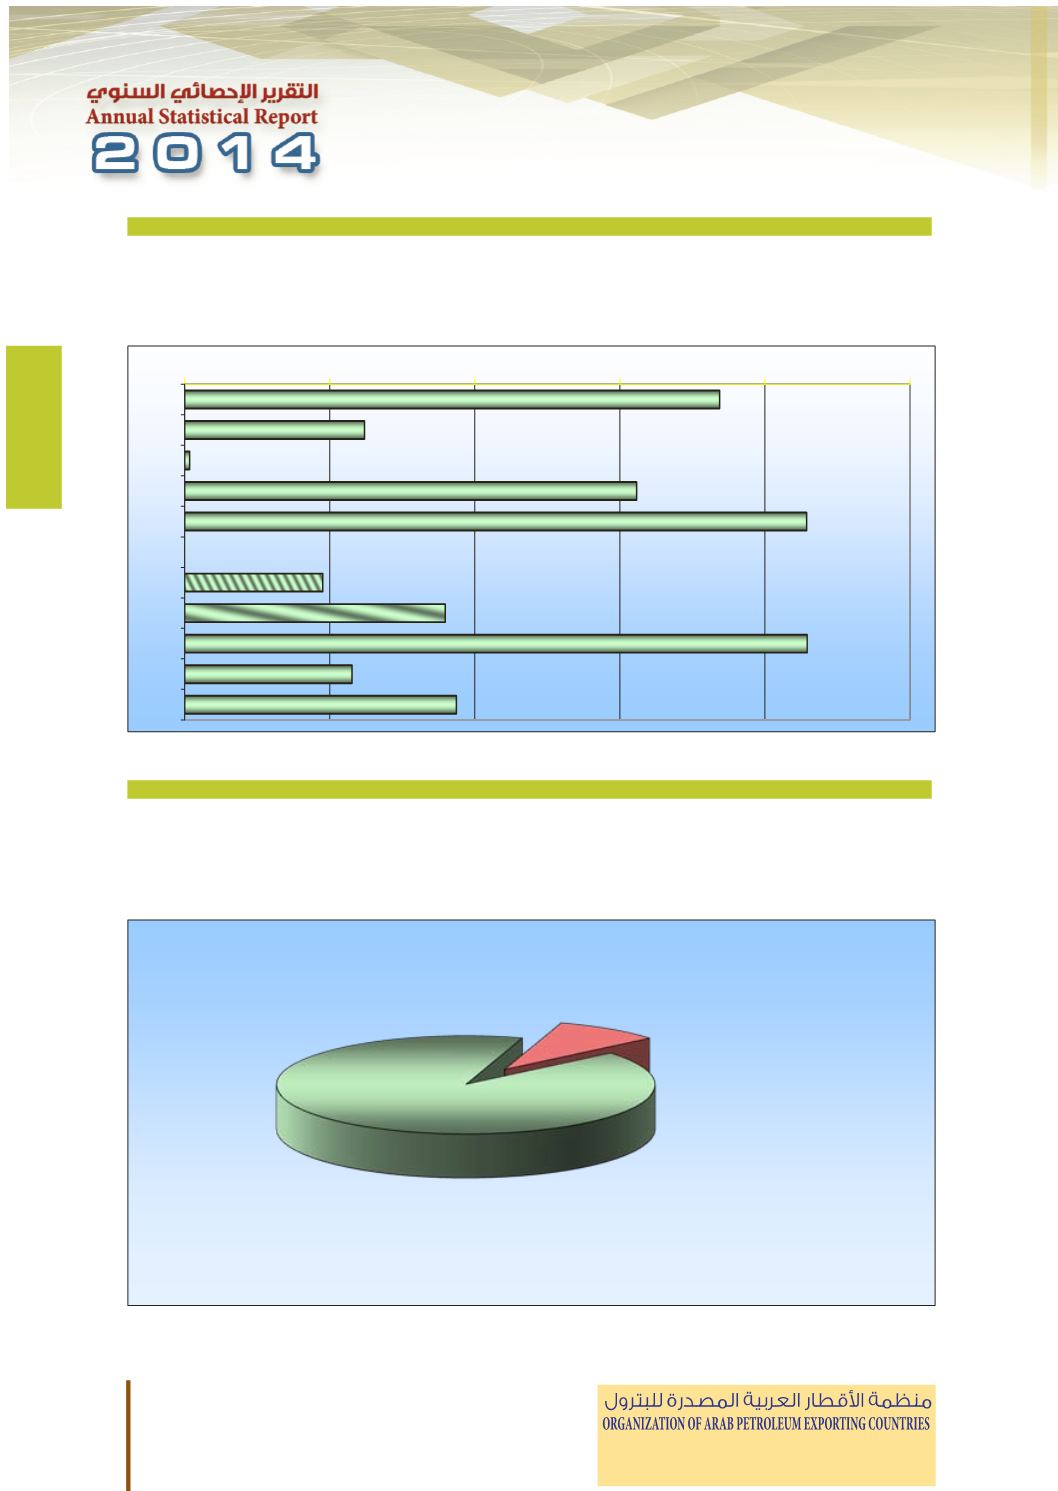
Other Oil Products Production
Thousand b
/
d
Year 2013
أخري
شتقات النفطية ال
�
انتاج الم
ألف برميل / يوم
�
2013
عام
Other Oil Products Production
)
%
(
Year 2013
أخري
شتقات النفطية ال
�
انتاج الم
)
%
(
2013
عام
58
Yemen
8.8
8.8
8.5
12.6
10.2
ϦϤϴϟ
OAPEC
1121.7
1110.6
1234.0
1238.3
1063.3
ϚΑϭ
Other Arab Countries
*
111.8
111.8
111.3
111.4
120.4
*
ϯήΧϷ ΔϴΑήόϟ ϝϭΪϟ
Total Arab Countries
1233.5
1222.4
1345.3
1349.7
1183.7
ΔϴΑήόϟ ϝϭΪϟ ϲϟΎϤΟ
* Year 2013 estimated.
* .
ΔϳήϳΪϘΗ
2013
ϡΎϋ ΕΎϧΎϴΑ
*
** Include asphalt, lubricants, naphtha and others.
* .
ϯήΧϭ ΖϴϳΰΘϟ ΕϮϳίϭ ΖϠϔγϻϭ ΎΜϓΎϨϟ ΝΎΘϧ ϞϤθΗ
**
Other Oil Products Production
ϱήΧϷ ΔϴτϔϨϟ ΕΎϘΘθϤϟ ΝΎΘϧ
Thousand b/d
ϡϮϳ
/
ϞϴϣήΑ ϒϟ
Year 2013
2013
ϡΎϋ
Other Oil Products Production
ϱήΧϷ ΔϴτϔϨϟ ΕΎϘΘθϤϟ ΝΎΘϧ
(%)
(%)
Year 2013
2013
ϡΎϋ
0
50
100
150
200
250
UAE
Bahrain
Tunisia*
Algeria
S.Arabia
Syria
Iraq
Qatar
Kuwait
Libya
Egypt
OAPEC
90.9%
Other Arab Countries
9.1%
58
* .
Δ
icants, naphtha and others.
* .
ϯήΧϭ ΖϴϳΰΘϟ ΕϮϳίϭ ΖϠϔ
roduction
ϱήΧϷ
roduction
ϱήΧϷ
50
100
150
200
OAPEC
90.9%
Other Arab Countries
9.1%


