244
39
th
Annual Report
Table (3-11)
shows the world’s ten largest ethylene production
complexes in 2011. The order remains unchanged from 2010.
Table (3-12)
compares the existing ethylene production capacity
worldwide by regions in 2010 and 2011.
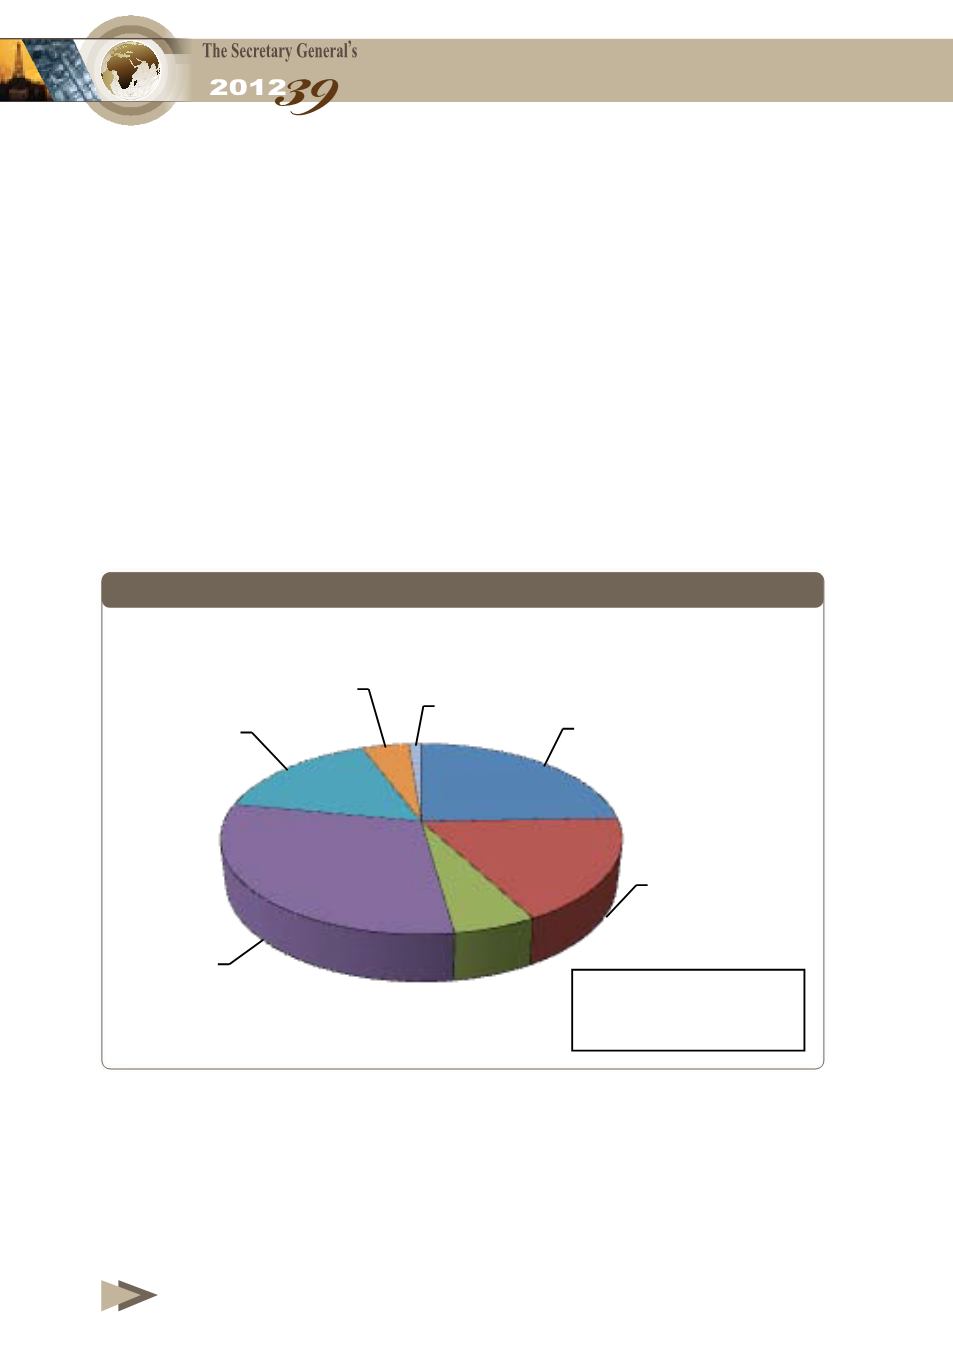
Figure (3-11)
shows distribution of total existing ethylene
capacities at the end of 2011.
South America recorded the biggest increase with a share of 1.3
million tons/year. Middle East came second, bringing on stream 1.2
million tons/year ethylene capacity, while Eastern Europe, North
America, Western Europe, Asia and Africa remained unchanged.
Figure 3-11
Distribution of Total Existing Ethylene Capacities at the end of 2011
Table (3-13)
shows distribution of ethylene production capacity
worldwide by countries in 2010 and 2011. It is noted that Venezuela
achieved the largest increase followed by Saudi Arabia.
North America
24.5%
Western Europe
17.7%
Eastern Europe/
CIS
5.7%
Asia/Pacific
30.2%
Middle East
16.2%
South America
4.5%
Africa
1.2%
140.955
Million tons


