256
39
th
Annual Report
Table (3-16)
and
Figure (3-13)
show the distribution of world
natural gas consumption by region in 2010 and 2011.
Figure 3-13
Figure 3-14
Share of Natural Gas in the Total Consumption of Commercial Energy, 2008-2011
(%)
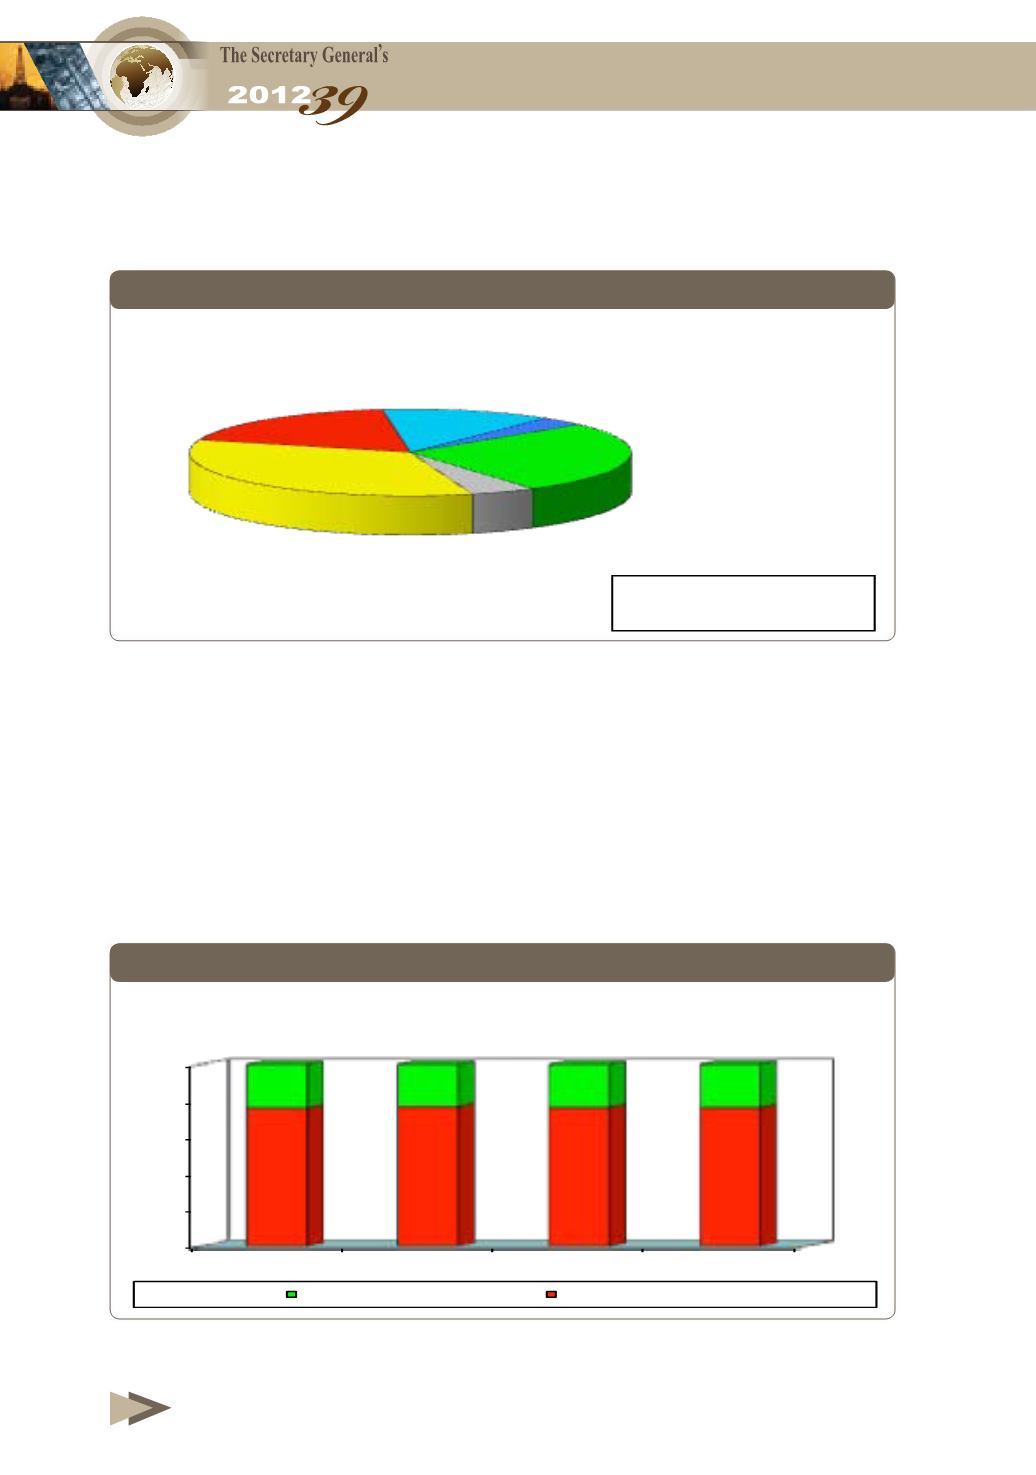
Distribution of Natural Gas Consumption by Region, 2011
In 2011, most regions of the world maintained its share of natural
gas in world commercial energy balance. The Middle East region
maintained the highest share with 48.5% against 47.4% in 2010. The
share ranged between 11.1% in Asia/Pacific and 33.9% in Europe
and Eurasia region.
Table (3-17)
and
Figure (3-14)
show the evolution of the share of natural
gas in total commercial energy consumption by region in 2008-2011.
North America
%26.8
South & Central
America
%4.8
Europe & Eurasia
%34.2
Asia/Pacific
%18.3
Middle East
%12.5
Africa
%3.4
3233.9
Billion cubic meters
0
20
40
60
80
100
2008
2009
2010
2011
76.0
76.6
76.3
76.3
24.0
23.4
23.7
23.7
Natural Gas
Other Energy Sources


