258
39
th
Annual Report
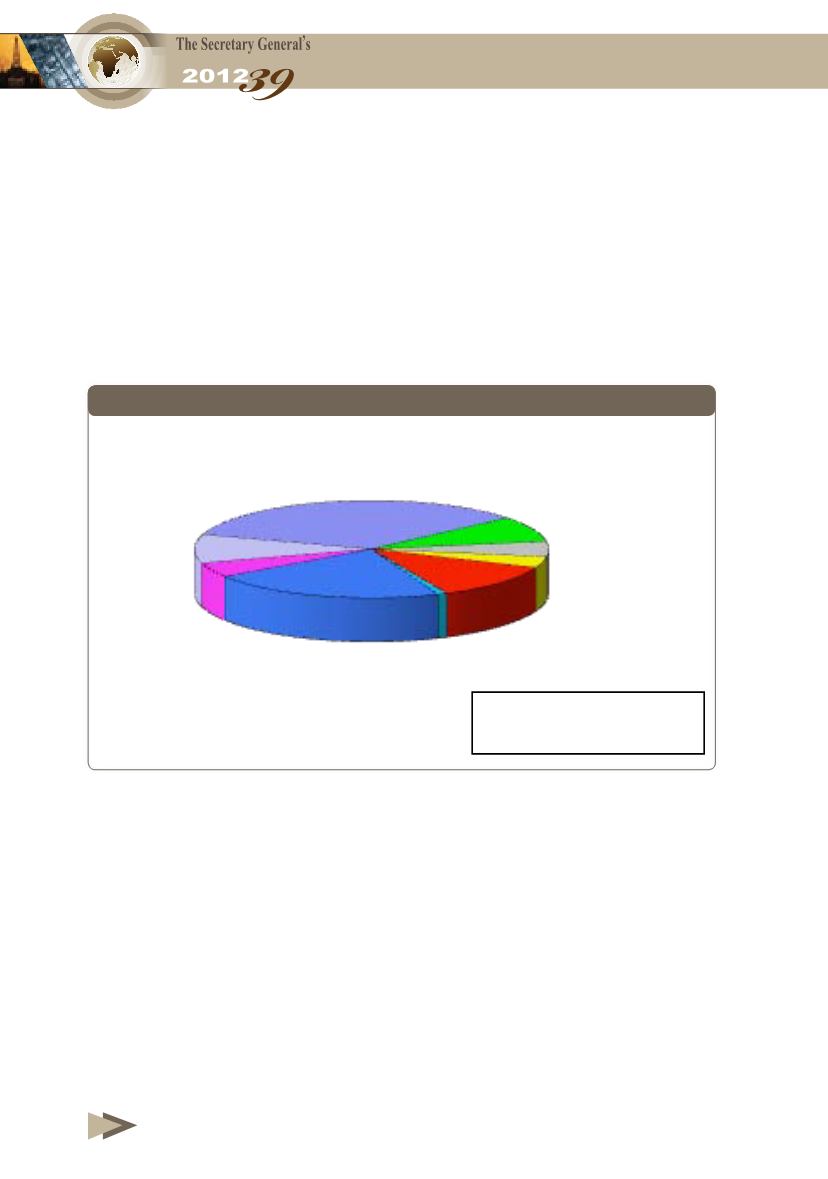
European countries totalled 221.4 billion cubic meters, which was
18.5 billion cubic meters less than in 2010. Qatar came second with
11.9%, followed by Norway with 9.4%, Canada 8.6%, Algeria 5%,
the Netherlands 4.9%, United States 4.2% and Indonesia 3.7%. The
exports of the aforementioned countries collectively constitute about
69.3% of total world exports of natural gas, as shown in
Table (3-18)
and
Figure (3-15)
.
Figure 3-15
Natural Gas Export Worldwide, 2011
The volume of natural gas exports by pipelines rose from about
685.6 billion cubic meters in 2010 to about 694.8 billion in 2011,
or by 1.3%, while LNG exports by tanker rose by 10% from 300.61
billion cubic meters to 330.8 billion cubic meters. Pipelines exports
accounted for 67.75% of total natural gas exports in 2011, with a
slight increase over the level 69.52% recorded in 2010.
LNG accounted for 32.25% of the total world natural gas exports in 2011,
against 30.48% recorded in 2010, as shown in
Table (3-19)
and
Figure (3-16)
.
Canada
%8.6
Algeria
%5.0
Indonesia
%3.7
Qatar
%11.9
Egypt
%0.8
Russia
%21.6
Netherlands
%4.9
Norway
%9.4
Rest of World
%34.0
1025.60
Billion cubic meters


