72
39
th
Annual Report
The second is those with a per capita GDP in excess of $3000, but
remains below the overall average for the Arab countries. The eight
countries in this group are Algeria ($5381), Libya ($4669), Jordan
($4622), Iraq ($4591), Tunisia ($4352), Egypt ($2928), Morocco
($2909) and Syria ($2850), as shown in
Figure (1-15)
.
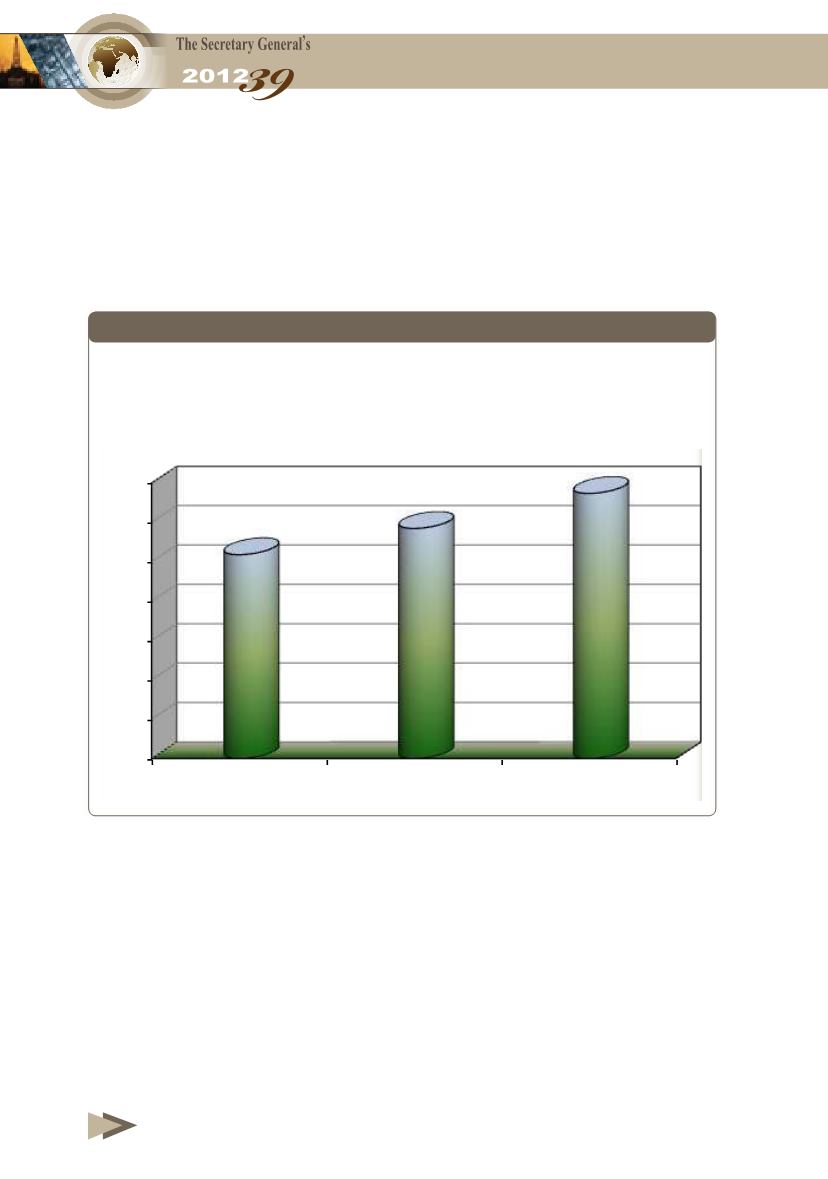
Figure 1-15
Per Capita GDP of Arab Countries in Current
Prices, 2009-2011
($)
Figure 1-15
Per Capita GDP of Arab Countries in Current Prices, 2009-2011
($)
2-
Population:
The average population growth in the Arab countries during 2009-
2012 was 2.34%, when the population of the Arab countries increased from 346
million in 2009 to about 370 million in 2012.
3-
Prices
: Due to the direct impact on middle classes and low-income, there is no
indication that Arab countries in the recent years have resorted to raising the
prices of oil products on the local markets in 2012. In terms of other Arab
countries, Jordan established a committee consisting of Ministry of Energy and
mineral resources, Ministry of Finance, and Jordan Petroleum Refinery Company
which conduct monthly meeting in order to review prices of oil products and
modify them in line with international prices trends in global markets.
1-2 Energy Consumption by Source
0
1000
2000
3000
4000
5000
6000
7000
2009
2010
2011
Population:
2-
The average population growth in the Arab
countries during 2009-2012 was 2.34%, when the population of the
Arab countries increased from 346 million in 2009 to about 370
million in 2012.
Prices
3-
: Due t the direct impact on middle classes and low-
income, there is no indication that Arab countries in the recent years
have resorted to ra s ng the prices of oil products on local markets


