76
39
th
Annual Report
The average of per capita consumption of energy hides significant
disparities among Arab countries, as it reached 18.7 boe in 2012 in
OAPEC member countries, compared with a level of 3.5 boe in
other Arab countries.
There is also variation within the member
countries with regard to this rate as Qatar recorded the highest rate
of consumption level of 267 boe in 2012.
Figure (1-17)
and Table
(1-18)
show the per capita energy consumption in Arab countries in
2009 and 2012.
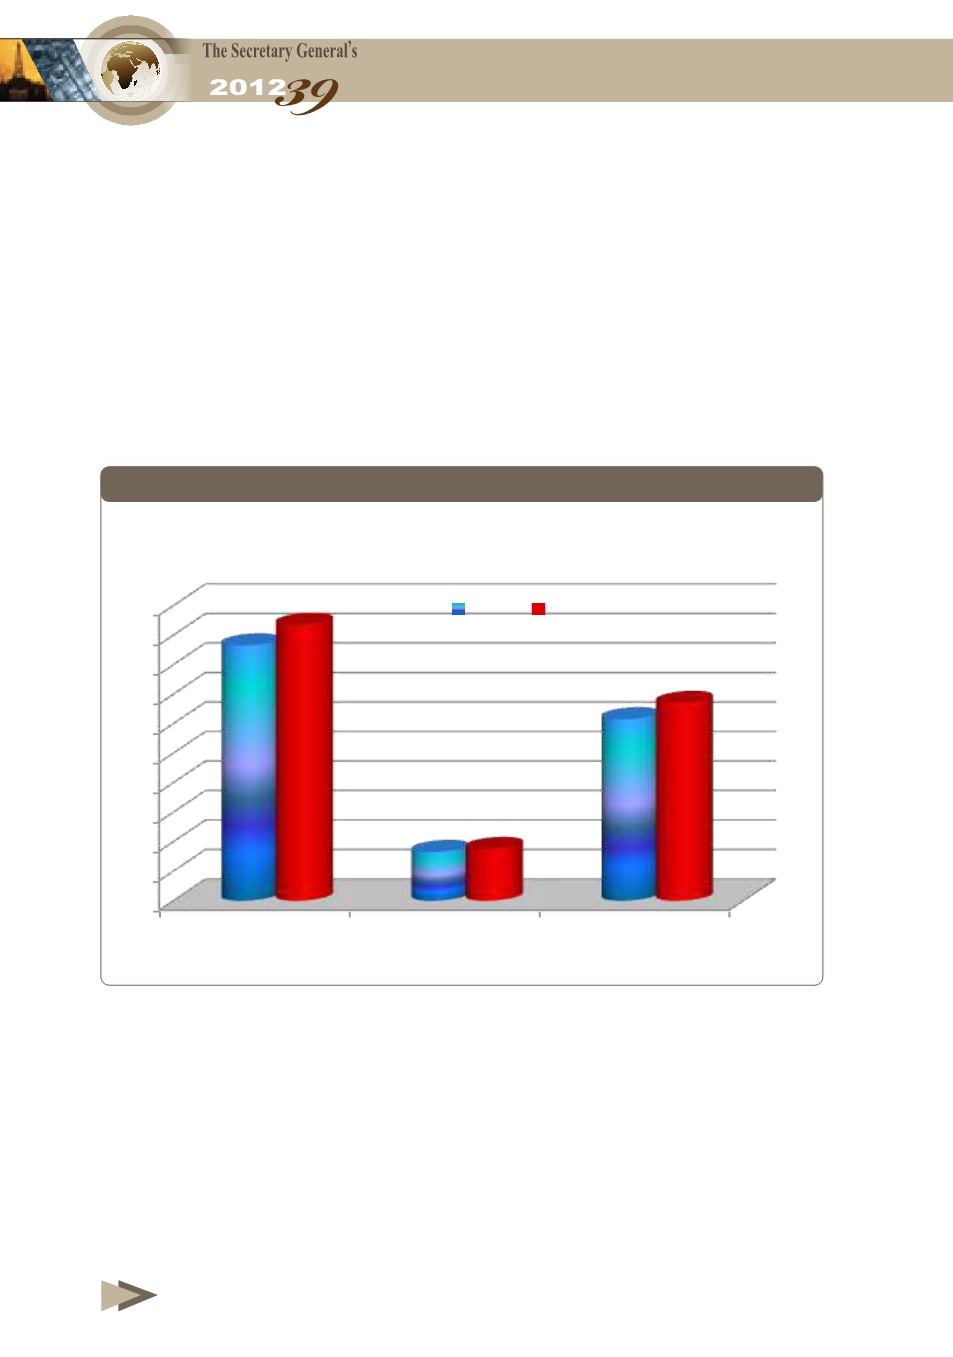
Figure 1-17
Per Capita Energy Consumption in the Arab Countries,2009 and 2012
(Boe/year)
25
- The
GDP
of OAPEC member countries accounted for about 85.7% of the Arab
countries GDP in 2011 compared to 83.1% and 84% in 2009 and 2010 respectively,
while the share of the rest of the Arab countries in Arab GDP declined to 14.3% in
2011 compared to 16.9% in 2009 and 16% in 2010.
-
Total population
: Population in the Member countries grew at annual rate of 2.7%
during the period 2009-2012, to 239.7 million n 2012.
The overall average rate of energy consumption per capita in the Arab countries
reached a level of 13.4 barrels of oil equivalent (boe) in 2012.
The average of per capita consumption of energy hides significant disparities
among Arab countries, as it reached 18.7 boe in 2012 in OAPEC member countries,
compared with a level of 3.5 boe in ther Arab countries.
There is also variation
within the member countries with regard to this rate as Qatar recorded the highest rate
of consumption level of 267 boe in 2012.
Figure (1-17)
and Table
(1-18)
show the
per capita energy consumption of the Arab countries in 2009 and 2012.
Figure 1-17
Per Capita Energy Consu pti
rab Countries,2009 and 2012
(Boe/year)
0
2
4
6
8
10
12
14
16
18
20
OAPEC member
Countries
Other Arab
Countries
Total Arab
Countries
2009 2012
In 2011, Arab countries, share of total world energy consumption
was 4.7%, while that of OECD countries was 45%, rest of developing
countries accounted for 42%, and the FSU countries with 8.3%
share, as shown in
Figure (1-18)
.


