


 34 / 44

34
Petroleum Devolopments
Volume 42 Issue 10
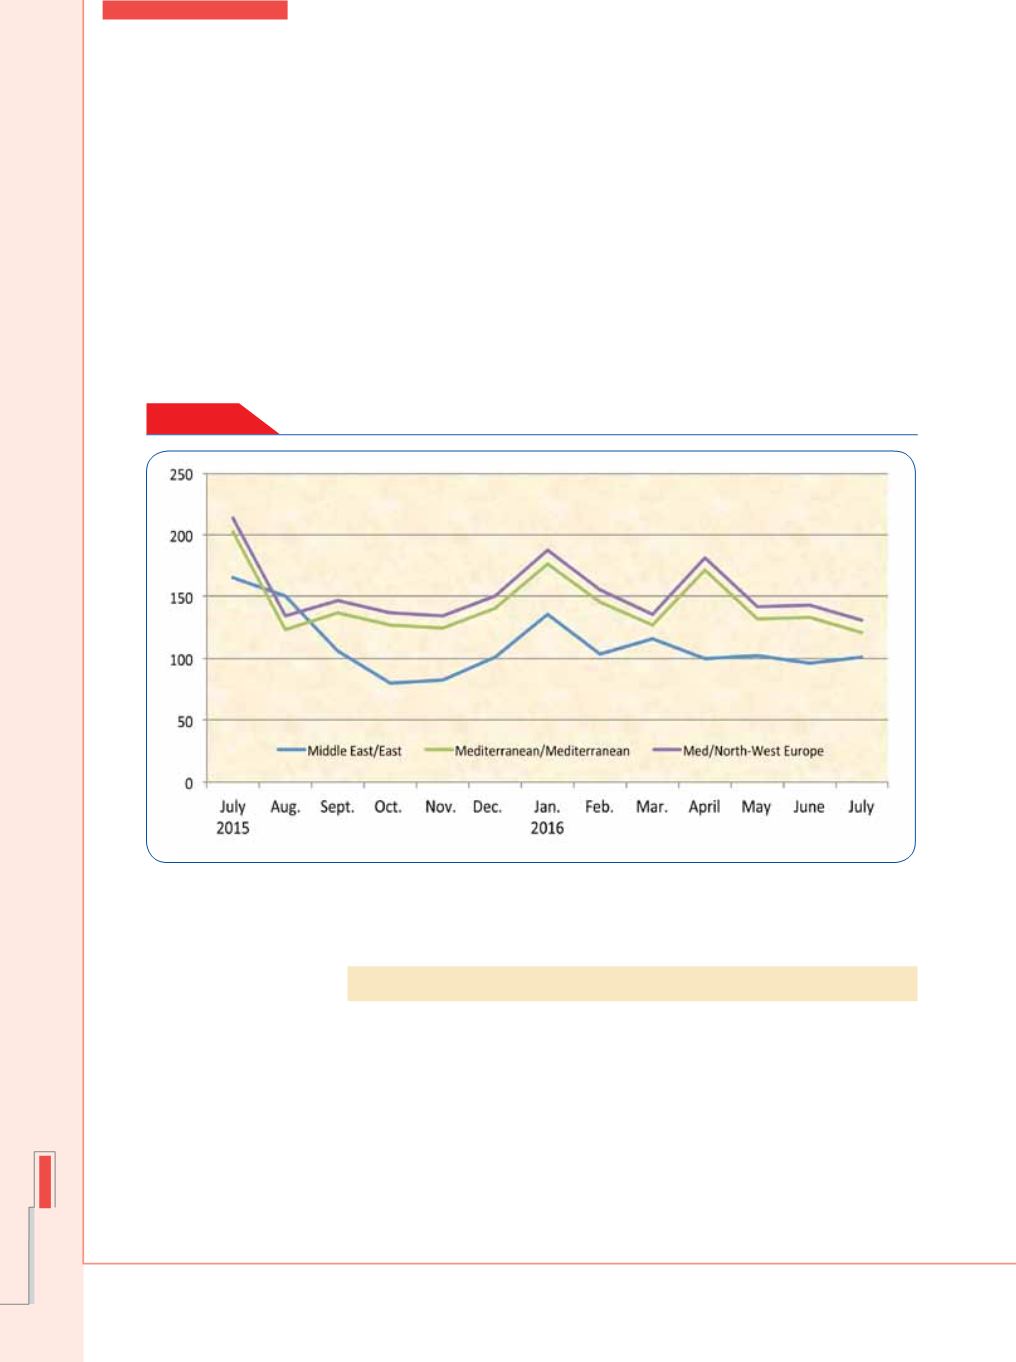
previous month to reach 101 points on WS. Whereas freight rates for
Petroleum Products across Mediterranean [for tanker size 30-35 thousand
deadweight tons (dwt)], decreased by 12 points, or 9% to reach 121 points
on WS, and freight rates for petroleum products [for tanker size 30-35
thousand deadweight tons (dwt)], leaving Mediterranean to North-West
Europe decreased by 12 points, or 8.4% to reach 131 points on WS.
Figure (5)
shows the freight rates for oil products to all three destinations
from July 2015 to July 2016.
Figure - 5
Monthly Spot Product Tanker Freight Rates, 2015 -2016
(World Scale)
Table (5)
and
(6)
in the annex show crude and products Tankers Freight
Rates, 2014-216.
2.Supply and Demand
Preliminary estimates in August 2016 show an increase in world oil
demand by 1.2% or 1.2 million b/d, comparing with the previous month
to reach 98.5 million b/d, representing an increase of 1.7 million b/d from
their last year level.
Demand in OECD countries decreased by 0.4% or 0.2 million b/d
comparing with their previous month level to reach 47.4 million b/d,
representing an increase of 0.7 million b/d from their last year level.
Whereas demand in Non-OECD countries increased by 2.8% or 1.4 million
b/d comparing with their previous month level to reach 51.1 million b/d,
representing an increase of 1 million b/d from their last year level.