
45
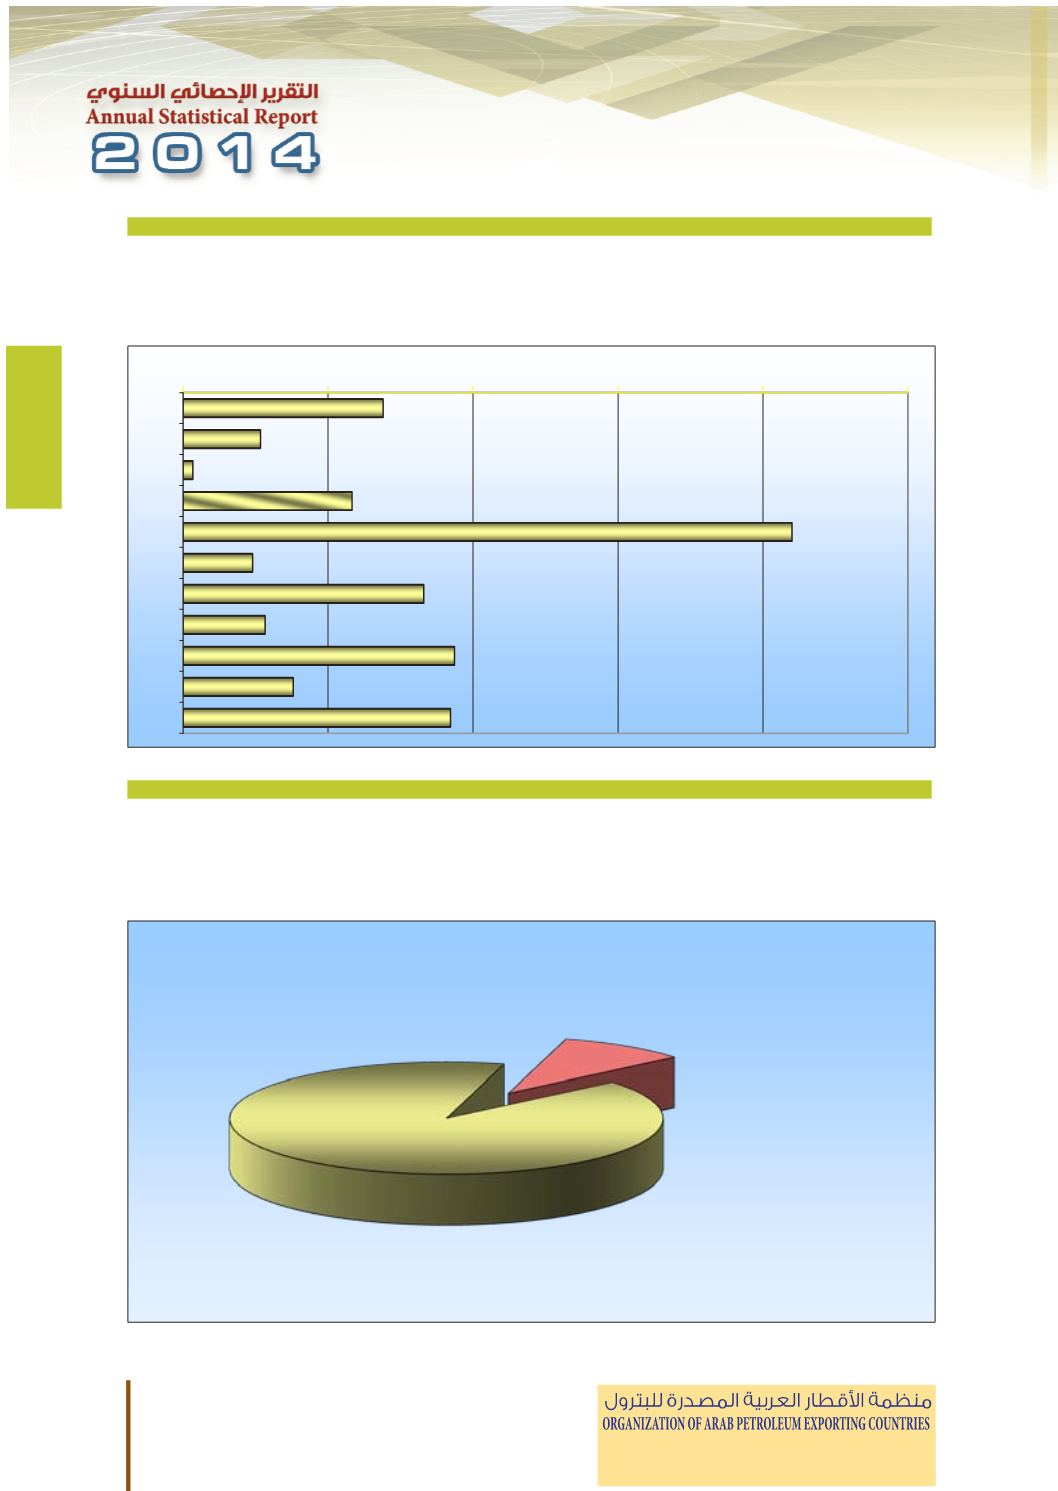
Installed Refining Capacity
Thousand b
/
d
Year 2013
صافي التكرير القائمة
�
طاقات م
ألف برميل / يوم
�
2013
عام
Installed Refining Capacity
)
%
(
Year 2013
صافي التكرير القائمة
�
طاقات م
)
%
(
2013
عام
44
Morocco
154.7
154.7
154.7
154.7
154.7
ΏήϐϤϟ
Mauritania
25.0
25.0
25.0
25.0
25.0
ΎϴϧΎΘϳέϮϣ
Yemen
140.0
140.0
140.0
140.0
140.0
ϦϤϴϟ
OAPEC
7265.3
7272.3
7262.3
7262.3
7099.3
ϚΑϭ
Other Arab Countries
772.1
772.1
772.1
772.1
772.1
ϯήΧϷ ΔϴΑήόϟ ϝϭΪϟ
Total Arab Countries
8037.4
8044.4
8034.4
8034.4
7871.4
ΔϴΑήόϟ ϝϭΪϟ ϲϟΎϤΟ
Installed Refining Capacity
ΔϤΎϘϟ ήϳήϜΘϟ ϲϓΎμϣ ΕΎϗΎρ
Thousand b/d
ϡϮϳ
/
ϞϴϣήΑ ϒϟ
Year 2013
2013
ϡΎϋ
Installed Refining Capacity
ΔϤΎϘϟ ήϳήϜΘϟ ϲϓΎμϣ ΕΎϗΎρ
(%)
(%)
Year 2013
2013
ϡΎϋ
0
500
1000
1500
2000
2500
UAE
Bahrain
Tunisia
Algeria
S.Arabia
Syria
Iraq
Qatar
Kuwait
Libya
Egypt
OAPEC
90.4%
Other Arab Countries
9.6%
ΔϤΎϘ
ΔϤΎϘ
500
1000
1500
2000
OAPEC
90.4%
Other Arab Countries
9.6%


