
47
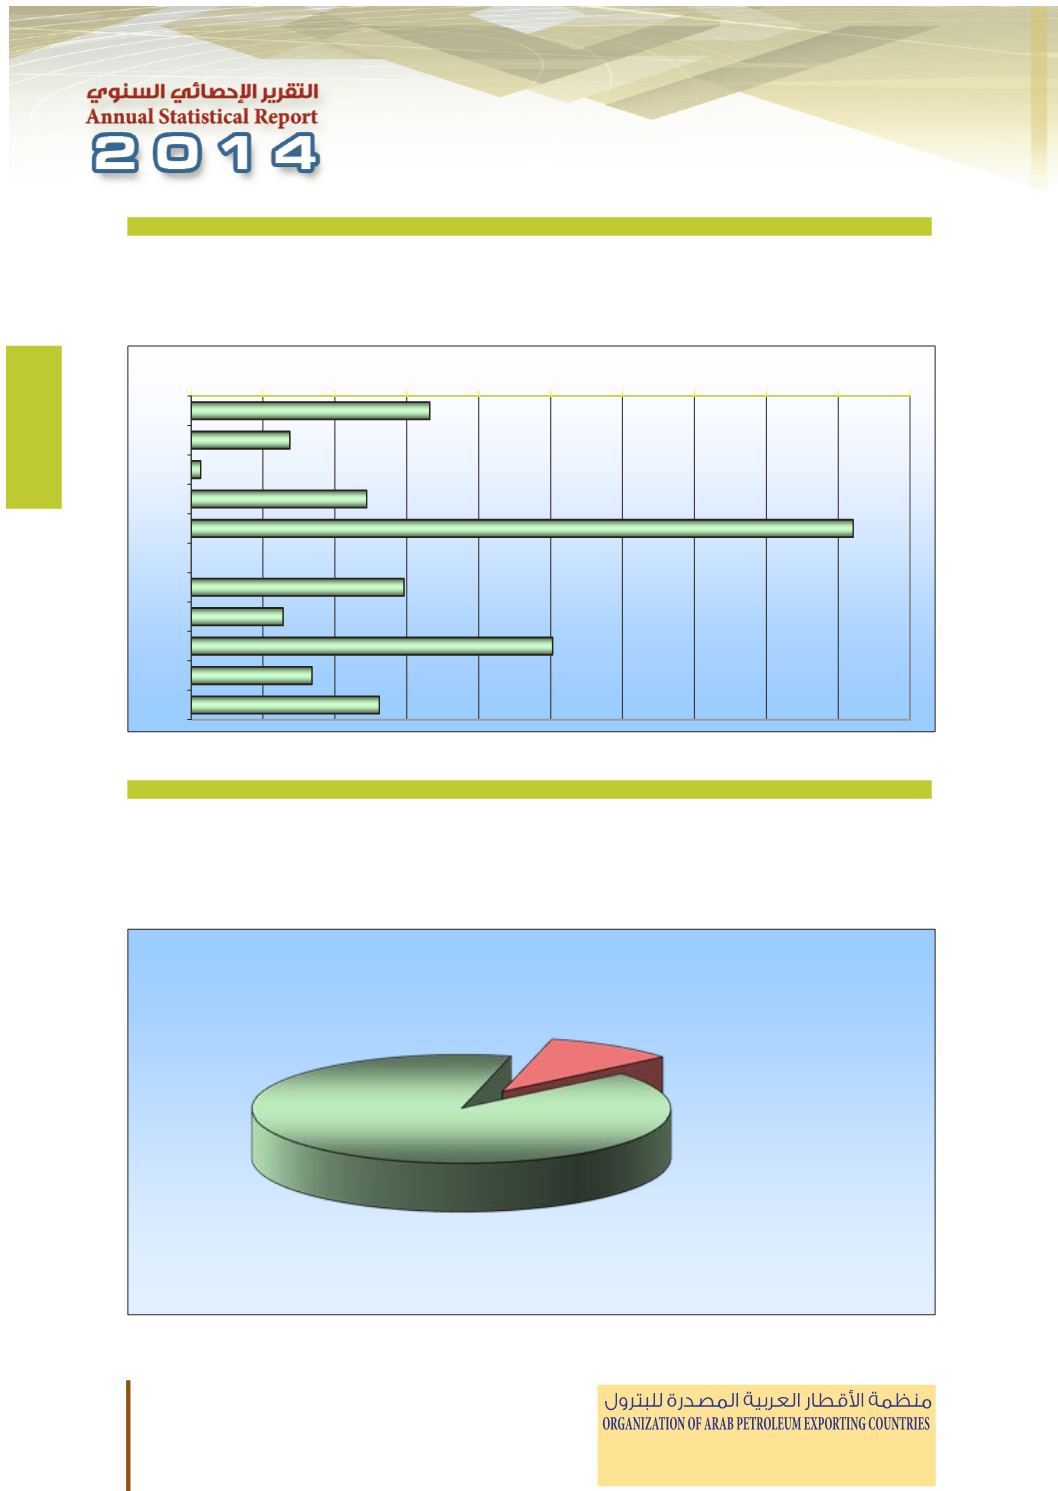
Total Oil Products Production
Thousand b
/
d
Year 2013
شتقات النفطية
�
اجمالي انتاج الم
ألف برميل / يوم
�
2013
عام
Total Oil Products Production
)
%
(
Year 2013
شتقات النفطية
�
اجمالي انتاج الم
)
%
(
2013
عام
46
Mauritania
23.0
23.0
23.0
24.2
24.2
ΎϴϧΎΘϳέϮϣ
Yemen
81.8
81.8
81.0
98.2
98.2
ϦϤϴϟ
OAPEC
6009.2
5873.9
6331.8
6360.2
5964.8
ϚΑϭ
Other Arab Countries*
673.2
673.2
667.1
635.2
660.7
*
ϯήΧϷ ΔϴΑήόϟ ϝϭΪϟ
Total Arab Countries
6682.4
6547.1
6998.9
6995.4
6625.5
ΔϴΑήόϟ ϝϭΪϟ ϲϟΎϤΟ
* Year 2013 estimated.
* .
ΔϳήϳΪϘΗ
2013
ϡΎϋ ΕΎϧΎϴΑ
*
** IncludeLPG production from outside refineries.
*
ϲϓΎμϤϟ ΝέΎΧ Ϧϣ ϝΎδϤϟ ϝϭήΘΒϟ ίΎϏ ΝΎΘϧ ϞϤθΗ
**
Total Oil Products roduction
ΔϴτϔϨϟ ΕΎϘΘθϤϟ ΝΎΘϧ ϲϟΎϤΟ
Thousand b/d
ϡϮϳ
/
ϞϴϣήΑ ϒϟ
Year 2013
2013
ϡΎϋ
Total Oil Products Production
ΔϴτϔϨϟ ΕΎϘΘθϤϟ ΝΎΘϧ ϲϟΎϤΟ
(%)
(%)
Year 2013
2013
ϡΎϋ
0
200
400
600
800
1000
1200
1400
1600
1800
2000
UAE
Bahrain
Tunisia*
Algeria
S.Arabia
Syria
Iraq
Qatar
Kuwait**
Libya
Egypt
OAPEC
89.9%
Other Arab Countries
10.1%
ction
ction
200
400
600
800
1000
1200
1400
1600
OAPEC
89.9%
Other Arab Countries
10.1%


