172
39
th
Annual Report
Figure (2-6)
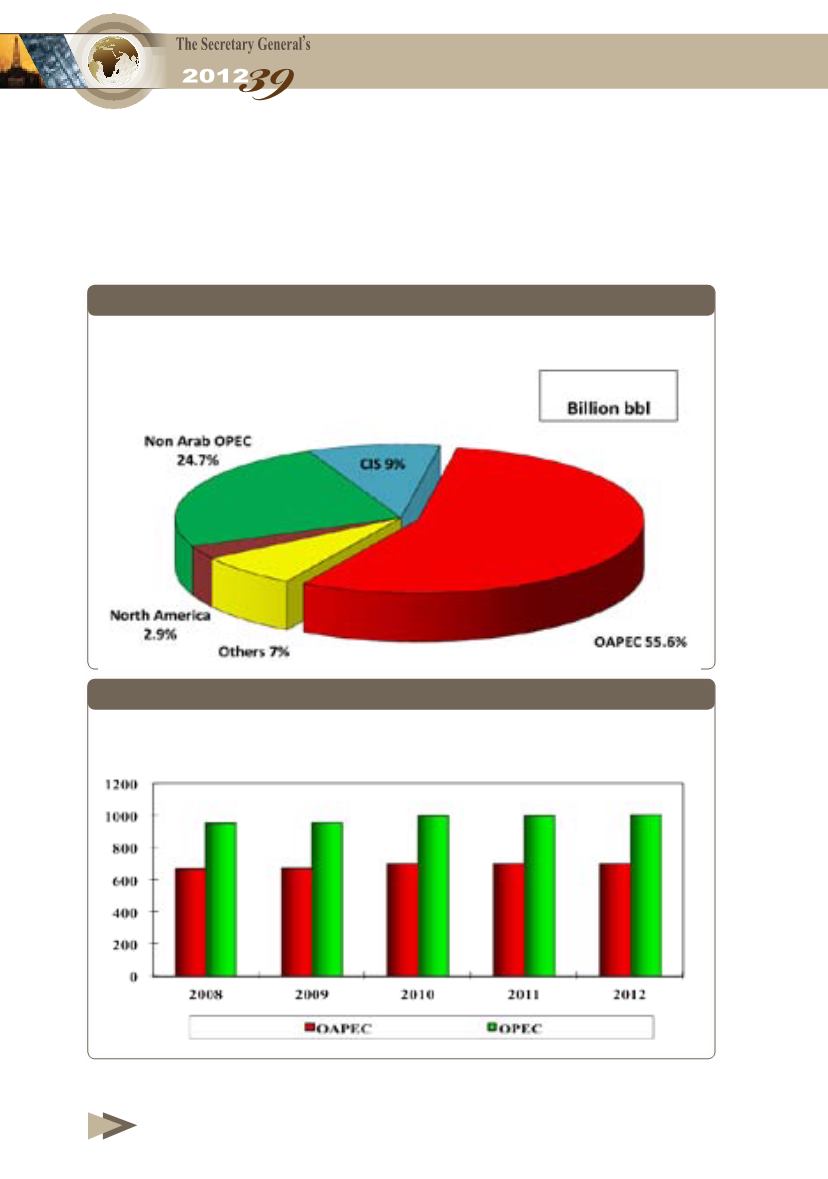
, shows the contribution rate of OAPEC members and
other international groups in global oil reserves by 2012 end, while
Figure (2-7)
shows OAPEC members’ proven oil reserves evolution
between 2008 and 2012.
Figure 2-6
Figure 2-7
World Oil Reserves by International Grouping
Billion barrel at year-end (%)
The Evolution of Oil Reserves in OAPEC and OPEC Member Countries, 2008- 2012
(Billion barrel at year-end)
1256.59


