270
39
th
Annual Report
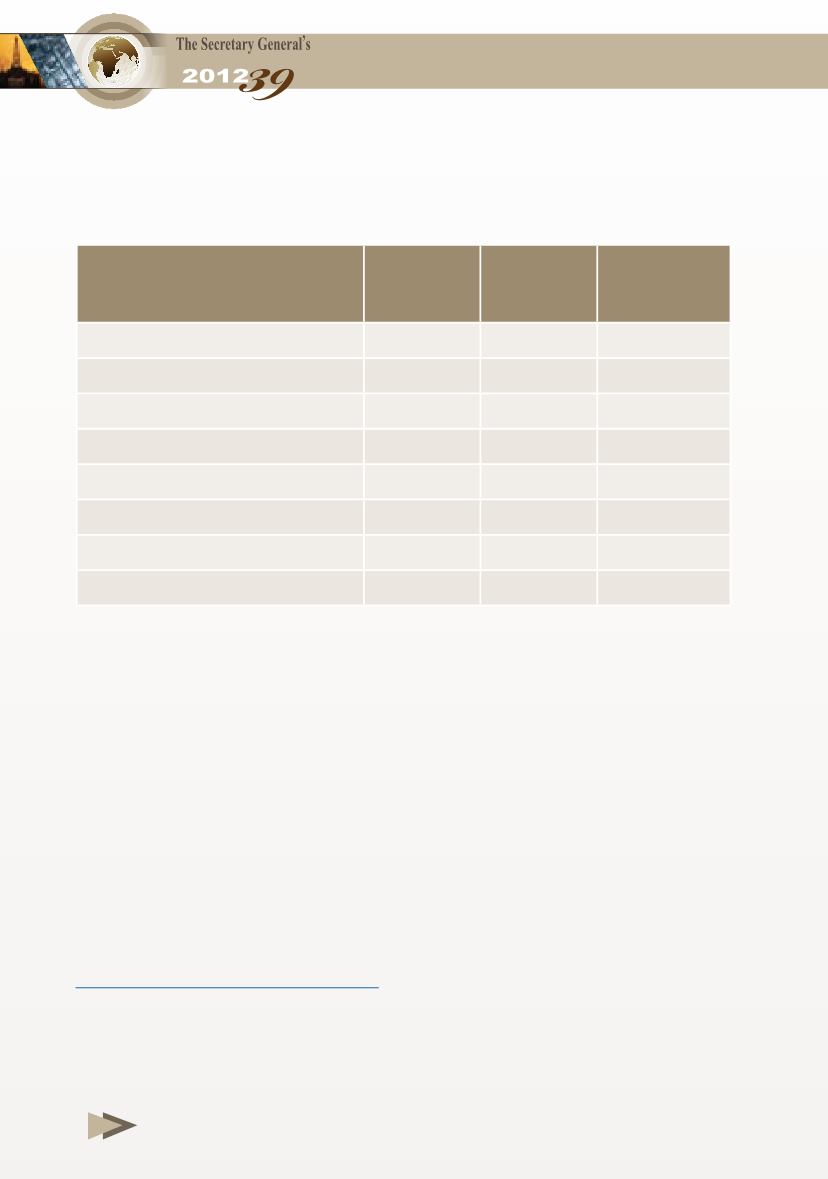
Table 3-2
World Catalytic Conversion Capacity by Region*,
2011 and 2012
(Million b/d)
* Includes catalytic cracking, hydrocracking and catalytic reforming.
Note: Parentheses denote negative figures.
Source:
- Oil & Gas Journal, 6 Dec. 2011 & 3 Dec. 2012.
2011
2012
)%(
Change
2012/2011
North America
12.58
12.62
0.32
Asia/Pacific
6.66
6.68
0.30
Western Europe
5.54
5.44
)1.80(
Eastern Europe/CIS
2.68
2.72
1.49
South America/Caribbean
1.84
1.84
0.00
Middle East
1.61
1.61
0.00
Africa
0.73
0.73
0.00
Total
31.64
31.64
)0.00(


