280
39
th
Annual Report
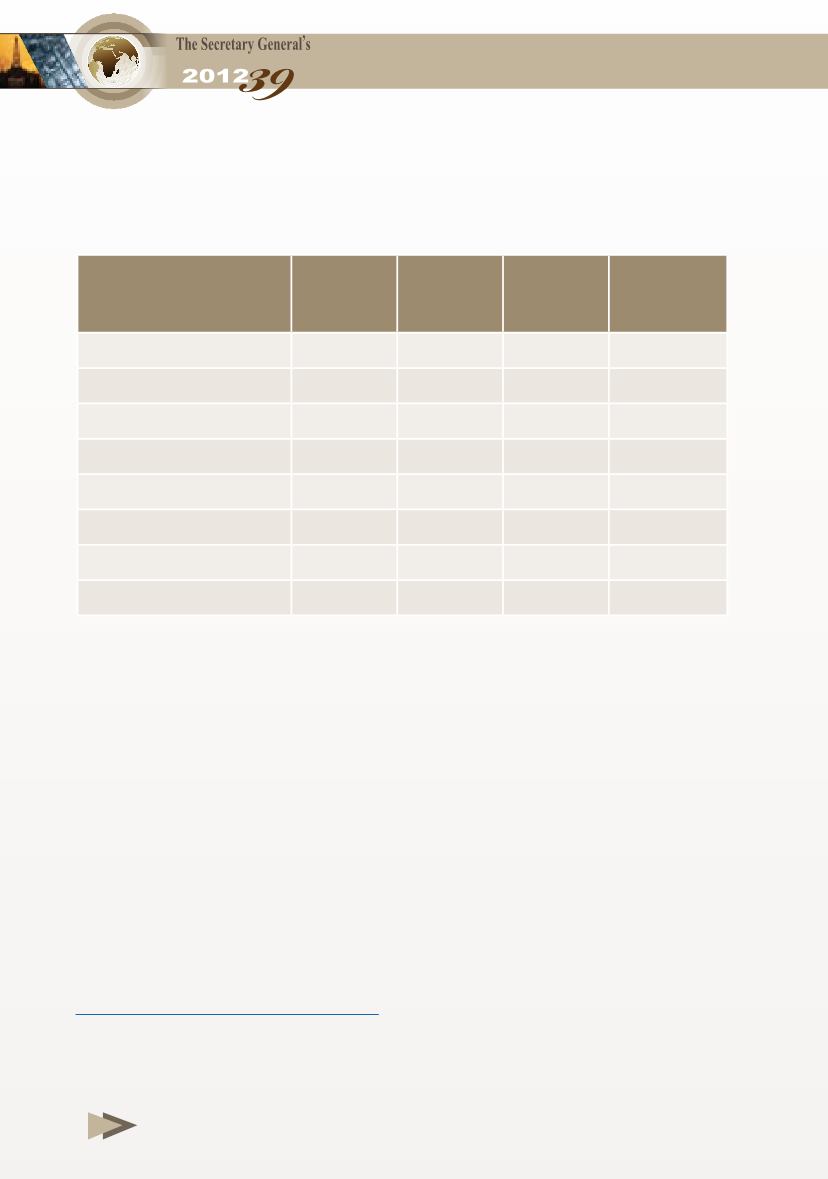
Table 3-12
World Ethylene Capacity by Region,
2010 and 2011
(Thousand tons at the end of the year)
Note: Parentheses denote negative figures.
Source:
- Oil & Gas Journal , 4 July, 2011 & 2 July, 2012
2010
2011 Difference
(%)
Change
2011/2010
North America
34508
34508
0.0
0.00
Asia/Pacific
42631
42631
0.0
0.00
Western Europe
24904
24904
0.0
0.00
Middle East
21659
22859
1200.0
5.54
Eastern Europe/CIS
7971
7971
0.0
0.00
South America
5084
6384
1300.0
25.57
Africa
1698
1698
0.0
0.00
Total
138455
140955
2500.0
1.81


