288
39
th
Annual Report
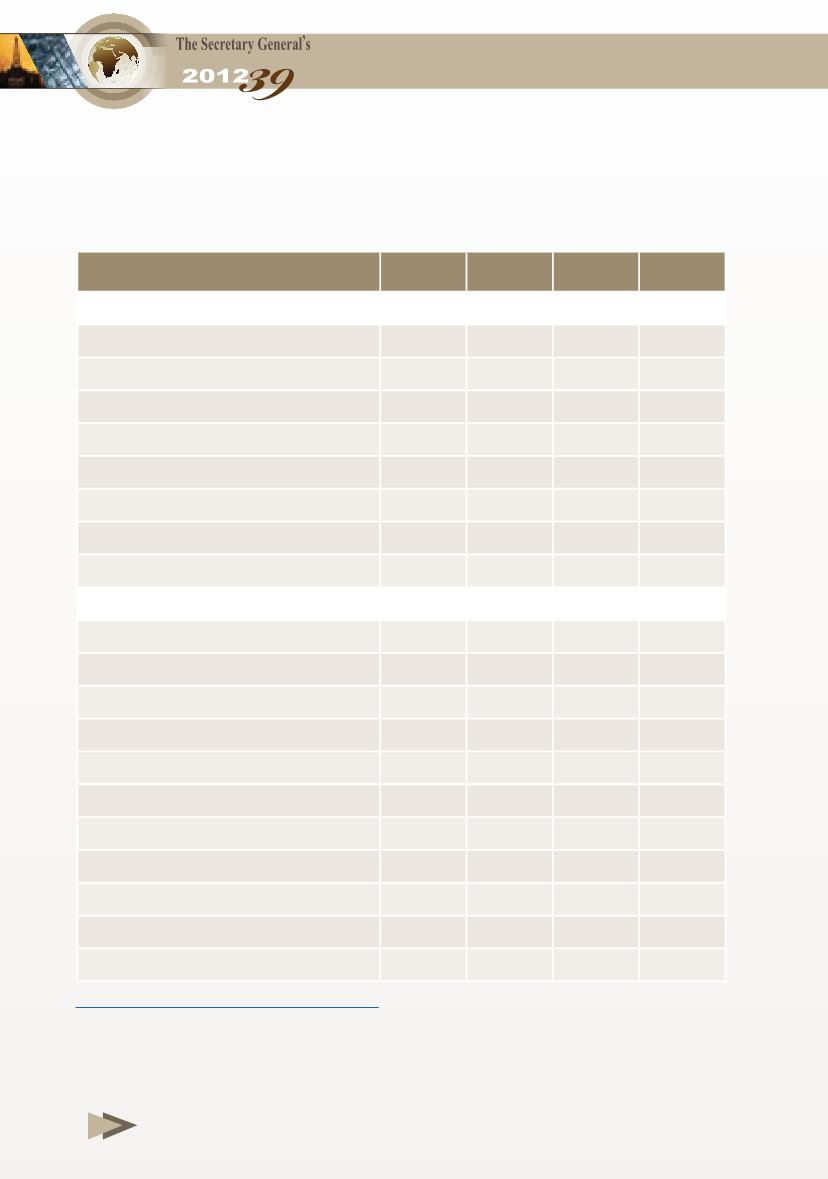
Table 3-19
World Natural Gas Exports by Region,
2010 and 2011
(Billion cubic meters)
* CIS , Europe and Turkey represented by Europe & Eurasia.
Source:
- BP Statistical Review of World Energy, June 2011 June 2012.
2010 (%)
2011 (%)
A- Exports by Pipeline.
Europe
194.30 28.3 180.90 26.0
Former Soviate Union
241.00 35.2 269.50 38.8
North America
123.60 18.0 128.80 18.5
Africa
55.00
8.0
42.70
6.1
Asia/Pacific
29.80
4.3
29.00
4.2
Middle East
27.60
4.0
28.30
4.1
South America
14.30
2.1
15.60
2.2
Total World Exports by Pipeline
685.60 100.0 694.80 100.0
B- Exports as LNG.
Europe
5.31
1.8
5.3
1.6
Former Soviate Union
13.40
4.5
14.4
4.3
North America
1.60
0.5
2.00
0.6
Africa
58.80
19.6
56.7
17.1
Asia/Pacific
97.90
32.6
97.8
29.6
Middle East
101.40 33.7
130
39.1
South America
22.20
7.4
24
7.1
Total World Exports as LNG
300.61 100.0 330.79 100.0
Total World Exports
986.21
1025.59
Exports by Pipeline/ Total Exports (%)
69.52
67.75
Exports as LNG/ Total Exports (%)
30.48
32.25


