290
39
th
Annual Report
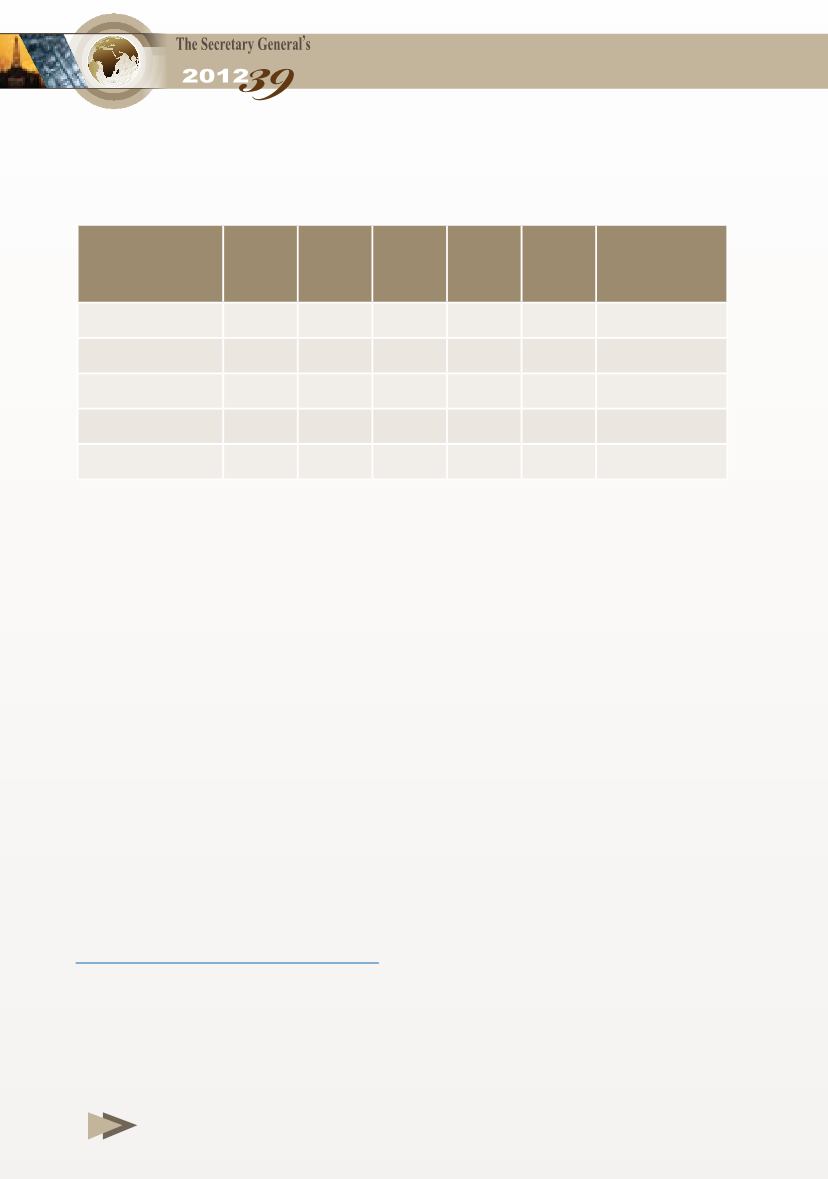
Table 3-21
Average World Natural Gas Prices*, 2007-2011
(Dollar/Million BTU)
* Average CIF Prices.
** LNG Prices
Note: Parentheses denote negative figures.
Source:
- BP Statistical Review of World Energy, June 2012.
2007 2008 2009 2010 2011
(%)
Change
2011/2010
USA
6.95 8.85 3.89 4.39 4.01
(8.7)
Canada
6.17 7.99 3.38 3.69 3.47
(6.0)
Japan**
7.73 12.55 9.06 10.91 14.73
35.0
European Union
8.93 12.61 8.52 8.01 10.61
32.5
UK
6.01 10.79 4.85 6.56 9.03
37.7


