44
39
th
Annual Report
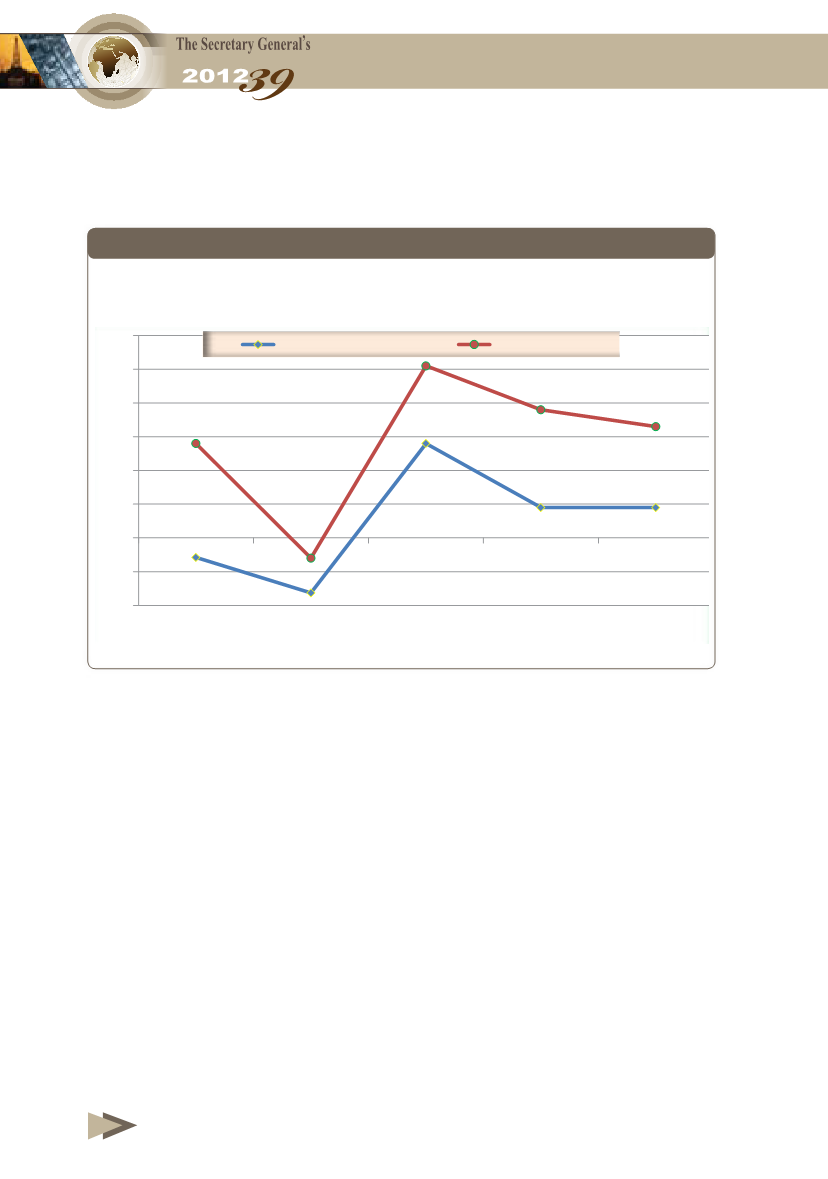
Figure (1-3)
and
Table (1-2)
show the annual rates of growth in
world oil demand compared with world economic growth rates.
Figure 1-3
World Economic and Demand Growth 2008-2012
(%)
Most economies witnessed more than expected
significant
decreases in their growth rates in 2012 which resulted in the mounting
pessimism over the global economic outlook, with downside risks
continuing to be presented by the sovereign debt crisis in the Euro-
zone; high unemployment in the advanced economies, and inflation
risk in the emerging economies.
In light of that the International Monetary Fund and other
specialized international institutions have reconsidered the global
economic growth in 2012 downwards several times during the year.
ﺍﻟﺷﻛﻝ
3
-2.5
-2
-1.5
-1
-0.5
0
0.5
1
2008
2009
2010
2011
2012
OPEC
Rest of the World
-2.0
-1.0
0.0
1.0
2.0
3.0
4.0
5.0
6.0
2008
2009
2010
2011
2012
Oil demand growth
GDP growth


