49
CHAPTER ONE
Developments in Global Markets
0
5
10
15
20
25
2008
2009
2010
2011
2012
North America
Western Europe
Pacific
50
60
70
80
90
100
110
120
130
Jan.
Feb.
Mar.
Apr.
May
June
July
Aug.
Sep.
Oct.
Nov.
Dec.
80
100
120
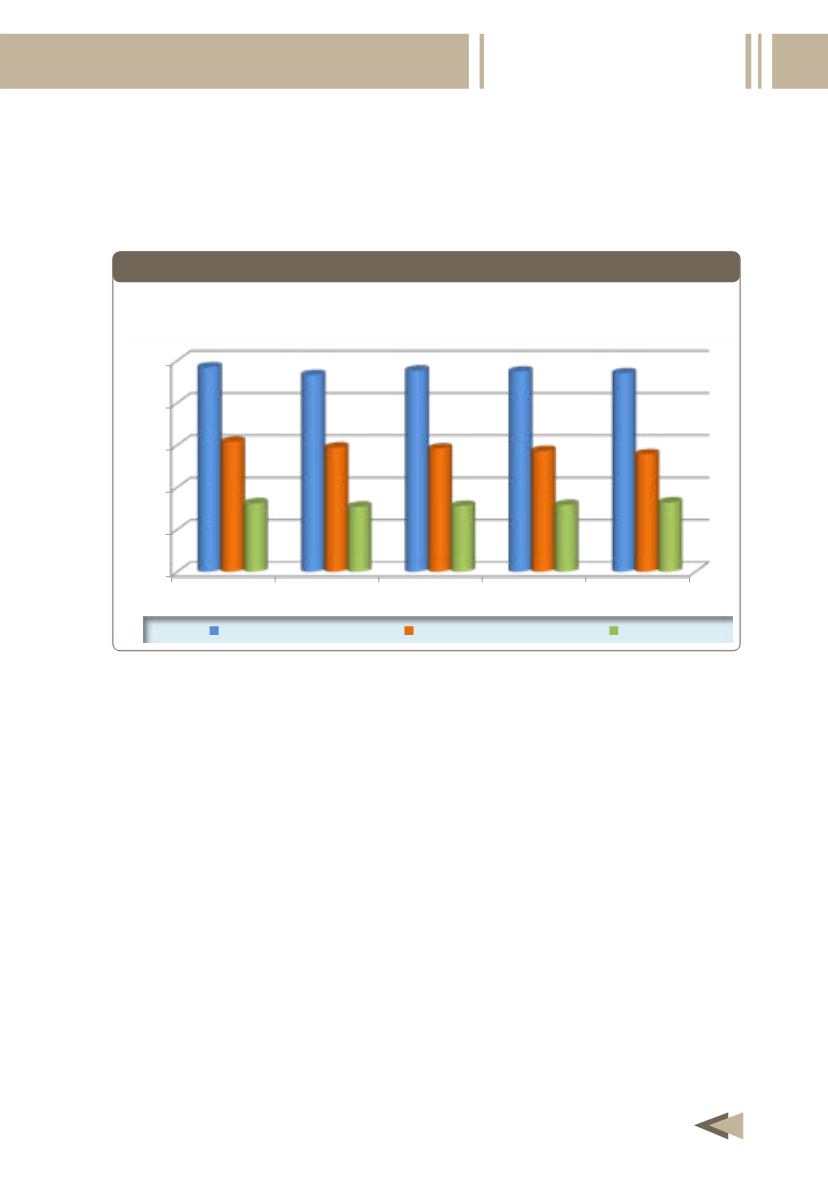
fell by 500,000 b/d to reach 13.8 million b/d, and Asian industrial
countries demand reached 8.2 million b/d, representing an increase
of 300,000 b/d, as shown in
Figure (1-7)
and
Table (1-6)
.
Figure 1-7
OECD Demand for Oil by Region, 2008-2012
(Million b/d)
Developments in the US economy is considered to be very
important factor affecting world oil consumption. In the last few
years, US oil consumption became unpredictable factor with respect
to the global oil demand. After relative marginal decline in US
growth in the first and third quarters of the year, signs of stability in
American oil consumption exhibited in the fourth quarter due to the
rise in retail prices and developments in US economy during the year.
As a result, US demand for oil products decreased by 1.6% in 2012
compared with the previous year. US demand for distillates declined
by 4% due to decline in industrial production . In contrast, gasoline
consumption was in a better position than the previous year in the
light of the improvement in the product consumption witnessed in
the U.S. market, especially at the end of the year.


