54
39
th
Annual Report
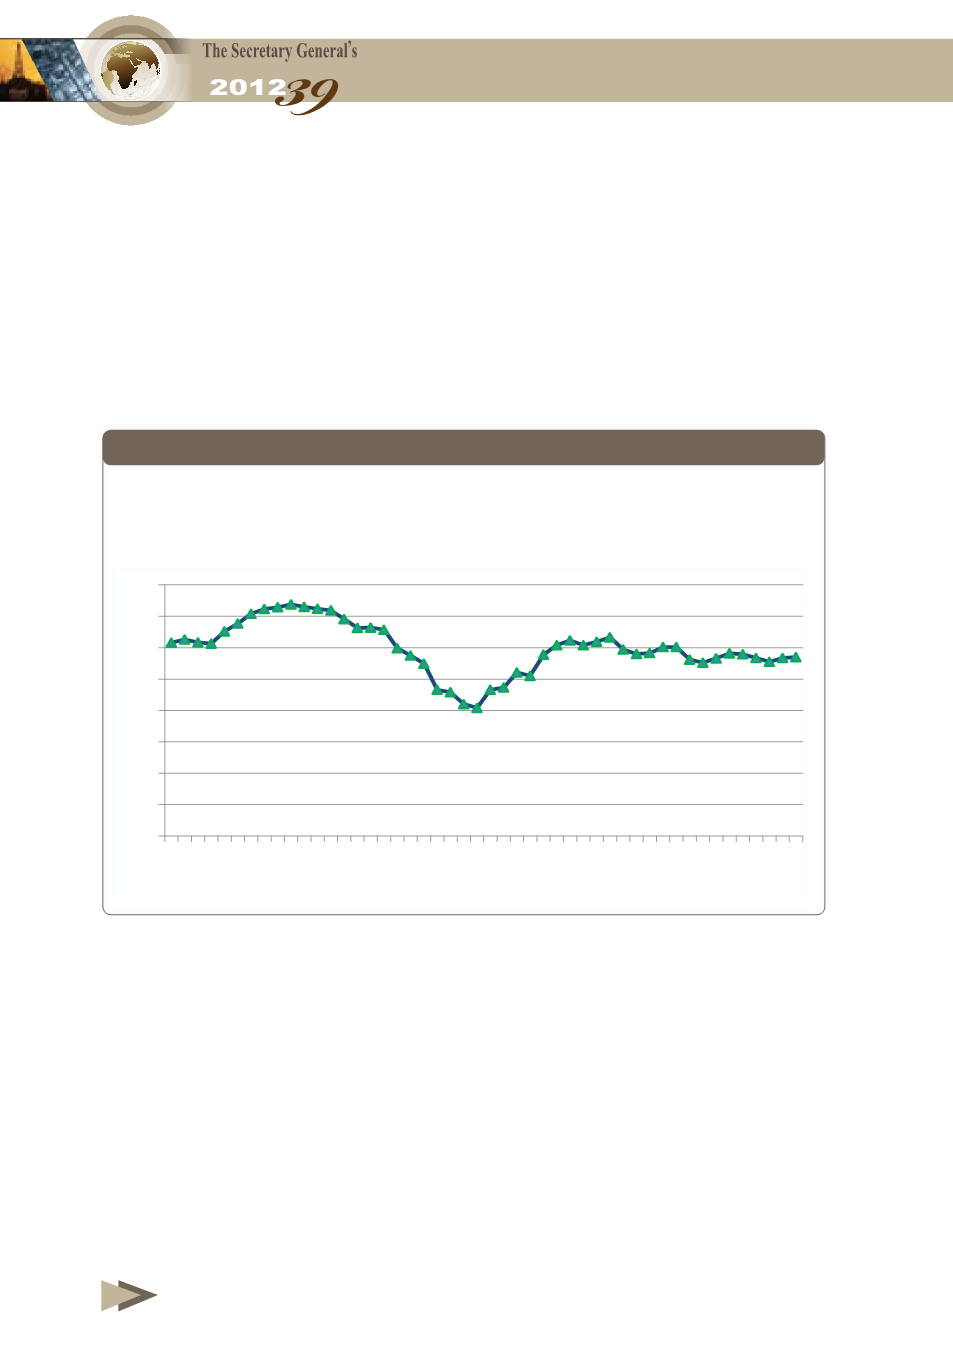
As a result of the above developments in oil prices, the difference
between the highest level of average of the OPEC basket price in
2012 which recorded in March ($123/b) and the lowest that reached
in June ($94/b) amounted to $29/b, compared with a difference of
$25.3/b between the highest and lowest level of monthly average
price in 2011, as shown in
Table (1-8)
.
Figure (1-8)
shows the weekly
movement of the OPEC basket price.
Figure 1-8
Weekly Movement of OPEC Basket of Crudes, 2012
($/b)
0
5
10
15
20
25
2008
2009
2010
2011
2012
North America
Western Europe
Pacific
50
60
70
80
90
100
110
120
130
Jan.
Feb.
Mar.
Apr.
May
June
July
Aug.
Sep.
Oct.
Nov.
Dec.
0
20
40
60
80
100
120
2008
2009
2010
2011
2012
OPEC Basket
WTI
Brent
Dubai
In view of the nature of international oil prices, the fluctuation in oil
prices is, usually, the result of the impact of a number of diverse and
overlapping factors acting in varying directions, some of which were
pushing prices upward and others were pushing them downward. As
it has been the case in previous year, geopolitical developments,
especially in the Arab region, representing one of the most important
factors that supported prices and pushed their levels up in 2012.


