


 101 / 222

مجلة النفط والتعاون العربي
161
العدد
- 2017
أربعون
المجلد الثالث و ال
2016
أوابك العلمية لعام
�
ص لبحوث العلمية الفائزة بجائزة
�
عدد خا
94
84
used to fill some of the gaps in consumption numbers. The available numbers are
for 2011 and they have been adjusted to 2014 by a growth rate of 2% a year to be
compatible with the consumption numbers that we have for the producers’
consumption cited above. This is an approximation which should be used with
care.
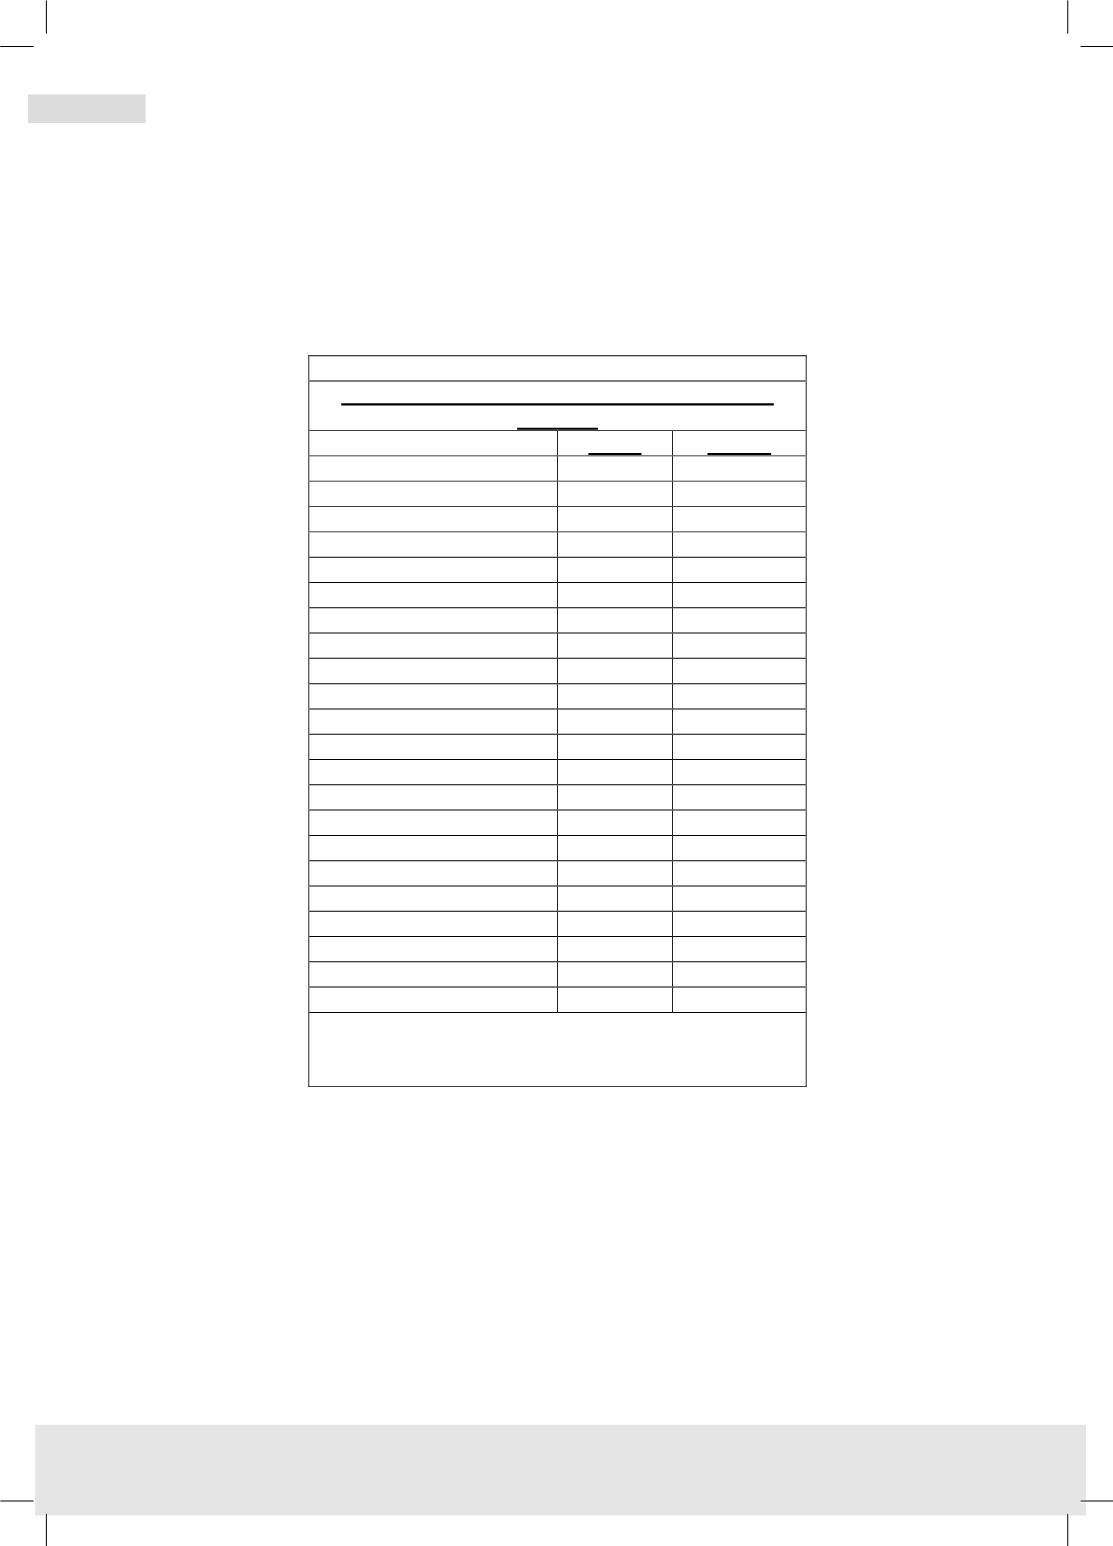
Table (22)
Lubricants Consumption in the Arab Countries
Ktons/Y
2011*
2014**
Algeria
87
Bahrain
17
Egypt
390
Iraq
195
Jordan
16
17
Jibouti
7
8
Kuwait
Libya
31
33
Lebanon
Mauritania
7
7
Morocco
117
Oman
69
73
Palestine
5
5
Qatar
Saudi Arabia
390
Somalia
Sudan
18
19
Syria
54
57
Tunisia
35
37
UAE
104
Yemen
TOTAL
242
1557
Source: * From UN Statistics ** From previous table
and from adjustment of UN Statistics numbers. Blanks
are for countries with no available data.
The probable consumption in the Arab countries could be about 1.7 million tons
a year, which by the end of 2016 is almost half of the production capacity. This
will open opportunities of trade among Arab countries in addition to exporting to
international markets
45
especially for the high quality products such as Group
III
42
. The higher quality of the new plants in Bahrain, Saudi Arabia and the UAE
is also likely to improve consum
er’s
behavior towards extending drain periods if
a pricing policy and public awareness campaign is on the cards.