


 76 / 222

البحـث الأول
مجلة النفط والتعاون العربي
161
العدد
- 2017
أربعون
المجلد الثالث و ال
2016
أوابك العلمية لعام
�
ص لبحوث العلمية الفائزة بجائزة
�
عدد خا
69
59
The EU Waste Directives 75/439/EEC as amended by 87/101/EEC and 91/692/
EEC had given priority to re-refining
1
in the use of collected used oil. But
individual countries
couldn’t meet this.
These countries say that re-refining is
uneconomic in their circumstance and that there is no clear cut environmental
advantage over burning
1
. Conflicting studies could not resolve this issue and the
EU “commissioned a review of existing environmental impact studies which was
published in 2001 and applied life cycle analysis to used oil disposal and
concluded that “p
riority to regeneration of waste oils over use as fuel is not
justified by any clear advantage
4
.
”
Members were quick to point out that life cycle
assessment studies (e.g. Sofres)
4
reached similar conclusion and that
environmental benefits come from increased collection rates of used oil rather
than its final use.
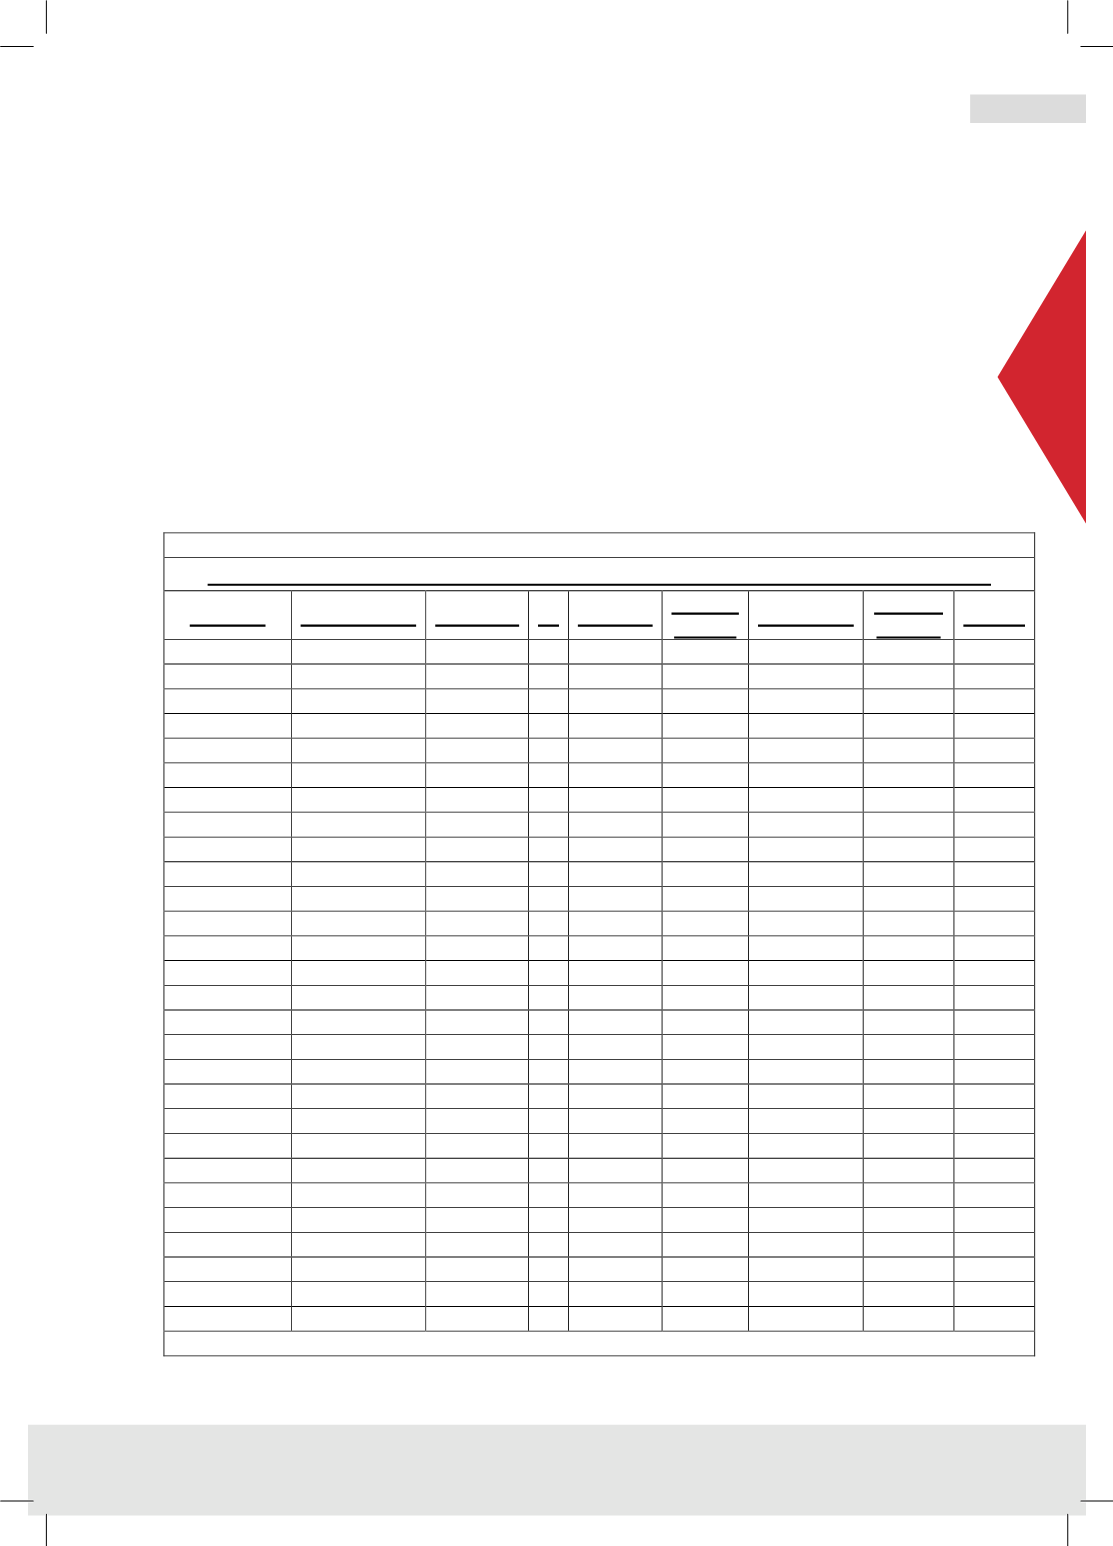
Table (7)
European Union Lubricating Oils Consumption and Disposition - 2006 - Thousand tons
Country
consumption Collected % Burning Process
to Fuel Rerefining Export/
Import Others
Austria
79
40
50
27
0
0
12
0
Belgium
142
60
42
1
25
0
15
20
Bulgaria
55
17
31
0
1
0
0
16
Cyprus
0
4
0
0
0
0
0
Czech R
111
33
30
32
0
0
1
0
Denmark
68
20
30
5
0
12
4
0
Estonia
19
5
28
5
0
0
0
0
Finland
79
23
28
23
0
0
0
0
France
765
225
29
93
7
94
5
25
Germany
1174
525
45
155
210
240
-105
0
Greece
100
36
36
0
0
36
0
0
Hungary
109
28
26
14
0
0
0
14
Ireland
38
20
53
0
0
0
0
0
Italy
542
216
40
33
1
173
0
1
Latvia
37
11
29
11
0
0
0
0
Lithwania
49
14
29
14
0
0
0
0
Luxembourg
10
5
54
0
0
0
5
0
Malta
4
1
30
0
0
0
0
0
Netherlands
252
50
20
0
0
0
50
0
Poland
351
77
22
13
0
49
15
0
Romania
130
28
21
19
6
0
0
2
Portugal
89
29
32
17
0
3
3
5
Slovenia
20
4
20
3
0
0
0
0
Slovakia
50
15
30
15
0
0
0
0
Spain
545
160
29
70
0
90
0
0
Sweden
148
45
30
37
0
0
8
0
UK
800
350
44
240
30
50
10
20
EU 2006
5766
2040
35
827
280
747
24
102
Source: 1 based on GEIR and collated by author.