
Petroleum Devolopments
Volume 41 Issue 10
31
US tight oil production
In August 2015, US tight oil production decreased by 77 thousand b/d
or 1.4% comparing with the previous month level to reach 5.366 million
b/d, representing an increase of 472 thousand b/d from their last year
level. Whereas, the US oil rig count increased by 9 rig comparing with the
previous month level to reach 588 rig, a level that is 688 rig lower than last
year, as shown in
table (3)
and
figure (7)
:
Source: EIA, Drilling Productivity Report for key tight oil and shale gas regions, September 2015.
* focusing on the seven most prolific areas, which are located in the Lower 48 states. These seven
regions accounted for 95% of domestic oil production growth during 2011-13 (Bakken, Eagle Ford
،
Haynesville
،
Marcellus
،
Niobrara
،
Permian
،
Utica)
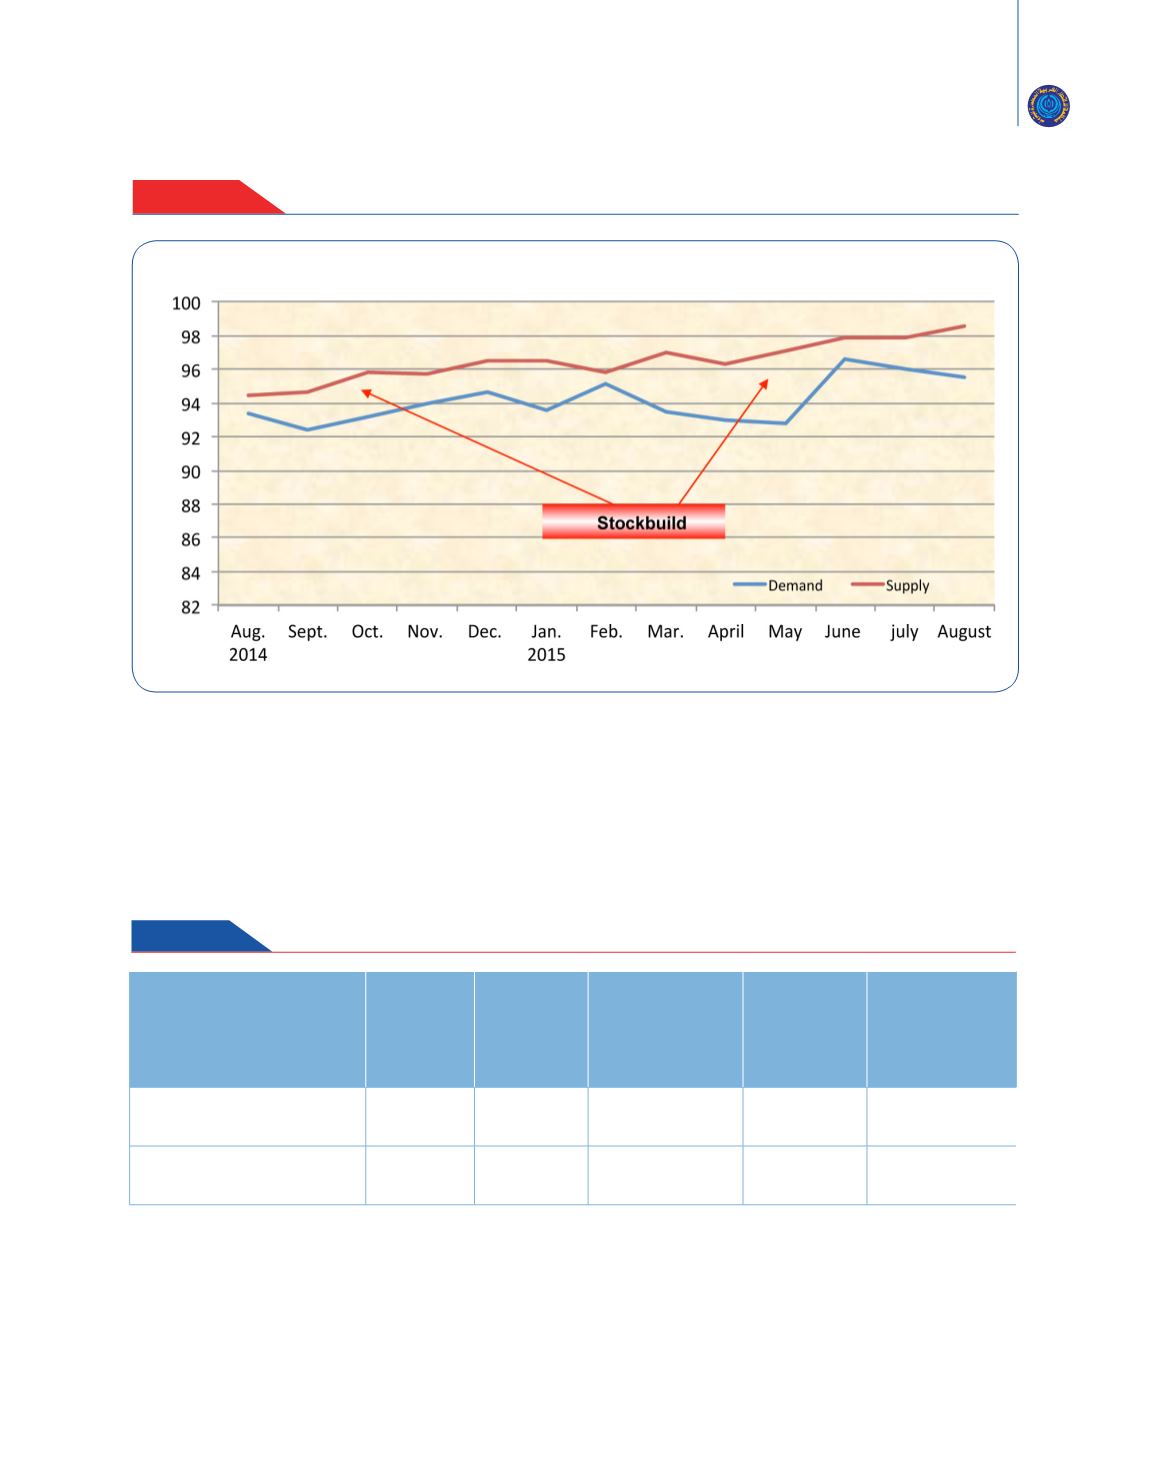
Figure - 6
World Supply and Demand
(Million b/d)
Table 3
US* tight oil production
(Million b/d)
Change from
August
2014
August
2014
Change from
July
2015
July
2015
August
2015
0.472
4.894
-
0.077
5.443
5.366
tight oil production
-
688
1276
9
579
588
Oil rig count (rig)


