


 17 / 32

Volume 41 Issue 12
17
Oct
.
Sept
.
Aug
.
July
June
May
Apr
.
Mar
.
Feb
.
Jan
.
2015
Dec
.
Nov
.
Oct
.
2014
45.0
44.8
45.5
54.2
60.2
62.2
57.3
52.5
54.1
44.4
59.5
75.6
85.1
OPEC Basket
Price
0.2
-
0.6
-
8.7
-
6.0
-
2.0
4.9
4.8
-
1.6
9.7
-
15.1
-
16.1
-
9.5
-
10.9
Chamge From
previous
Month
-
40.0
-
5.12
-
55.3
-
51.4
-
47.7
-
43.3
-
47.0
-
51.7
-
51.3
-
60.3
-
48.2
-
29.4
-
21.6
Change from
same month of
previous Year
* Effective June 16,2005 OPEC replaced its seven-crude basket with one comprised of eleven crudes, one from each member
country (weighted according to production and exports to major markets). Effective 1 January and mid of October 2007,
Angola’s Girassol and Ecuadorian Oriente crudes have been incorporated to become the 12th and 13th crudes comprising
the new OPEC Basket. As of Jan.2009, the basket excluded the Indonesian crude.
Table (3)
in the annex show spot prices for OPEC basket and other
crudes for the period 2013-2015.
1-2 Spot Prices of Petroleum Products
- US Gulf
In September 2015, the spot prices of premium gasoline decreased
by 18.4% or $14.9/bbl comparing with their previous month levels to
reach $65.8/bbl, spot prices of fuel oil decreased by 2.2% or $0.8/bbl
to reach $34.9/bbl, whereas spot prices of gas oil increased by 0.5% or
$0.3/bbl to reach $58.3/bbl.
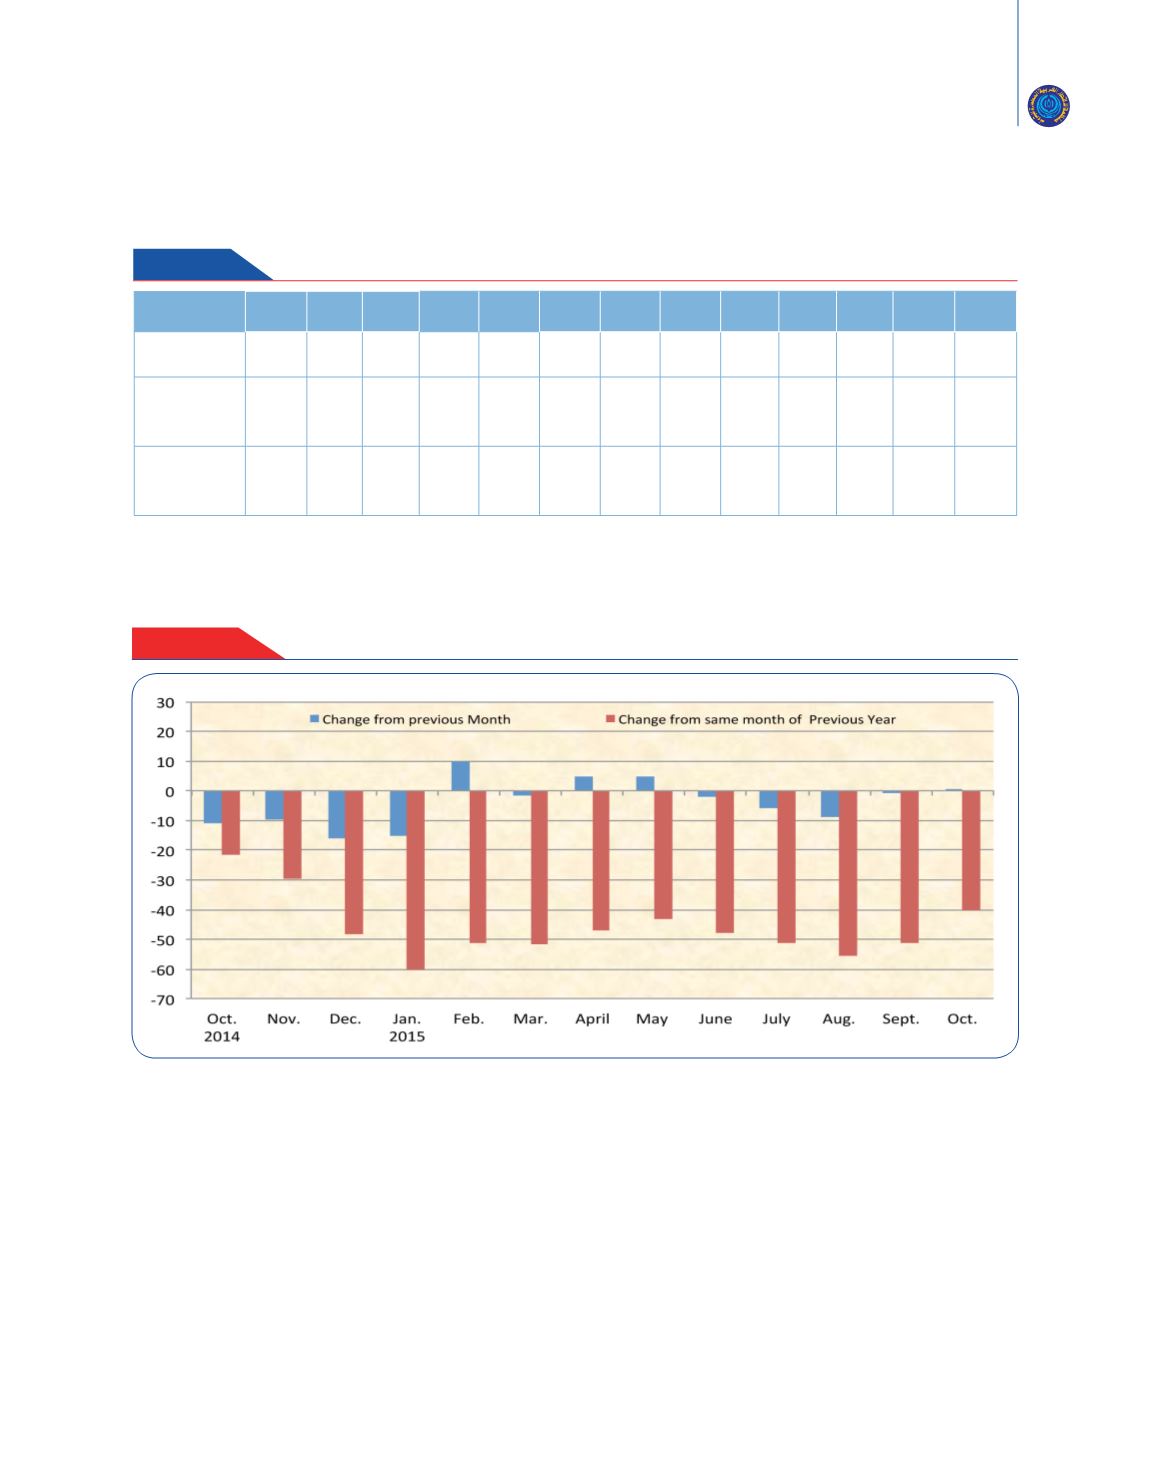
Figure - 2
Table 1
Table (1)
and
figure (2)
show the change in the price of the OPEC basket
versus last month and the corresponding month of last year :
Change in Price of the OPEC Basket of Crudes, 2014-2015
($/bbl)
Change in the Price of the OPEC Basket of Crudes, 2014-2015
($/bbl)