105
Tables Chapter One
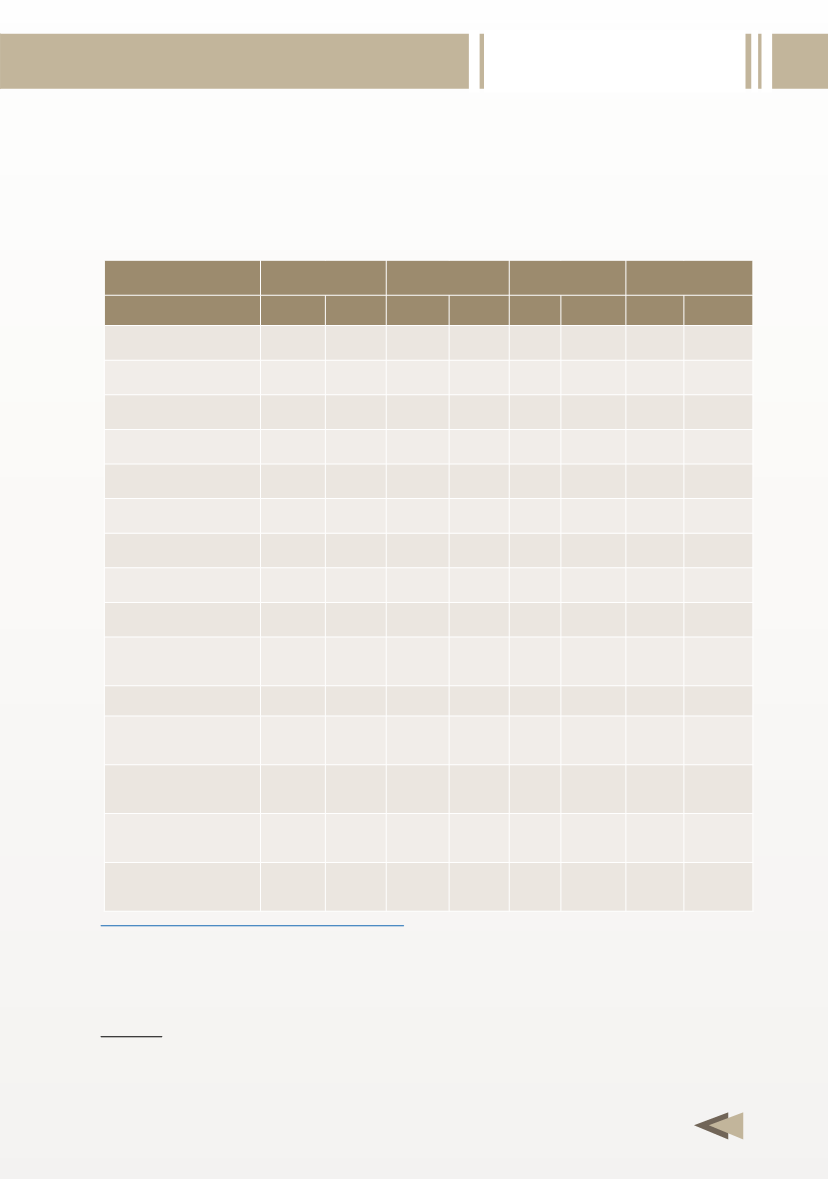
Table 1-14
OECD Oil Inventories at Quarter End,
2011 & 2012
(Million barrel)
* Estimated data.
** Oil At Sea and Independent storage.
*** Stock holding over the above minimum operating needs (55 days).
Sources:
- OAPEC - Economics Department
- EIG Inc., Oil Market Intelligence (various issues).
First quarter Second quarter Third quarter Fourth quarter
2011 2012 2011 2012 2011 2012 2011 2012*
North America
1304 1313 1309 1318 1337 1314 1275 1310
Of which: USA 1056 1082 1070 1112 1097 1074 1022 1074
Europe
973 908 939.3 920.7 924.3 931.3 919 932.7
Pacific
388.7 384.3 410.3 400 412.3 406.7 389 394.7
Total OECD
2666 2605 2659 2639 2673 2651 2583 2637
Rest of the World 1641 1662 1648 1692 1676 1694 1673 1638
Other Inventories** 1053 959.7 1032 974 994.3 960.3 964 937
Total Commercial
5361 5226 5338 5305 5343 5306 5219 5246
Strategic :
1769 1782 1787 1799 1773 1826 1775 1846
US Strategic
Petroleum Reserves 726.5 696.0 726.5 696 696 696 696 696
Usable Commercial*** 1509 1374 1486 1454 1492 1455 1368 1394
OECD Commercial
(days supply)
59.0 58.0 58.0 58.0 58.0 60.0 57.9 57.1
Total Commercial
(days supply)
70.6 69.0 70.0 71.3 69.0 69.2 68.6 69.1
OECD Strategic
(days supply)
35.0 34.0 34.0 33.0 33.0 33.0 33.0 33.0
Usable Commercial
(days supply)
18.1 14.0 15.0 15.1 15.0 14.1 17.9 13.9


