98
39
th
Annual Report
Table 1-7
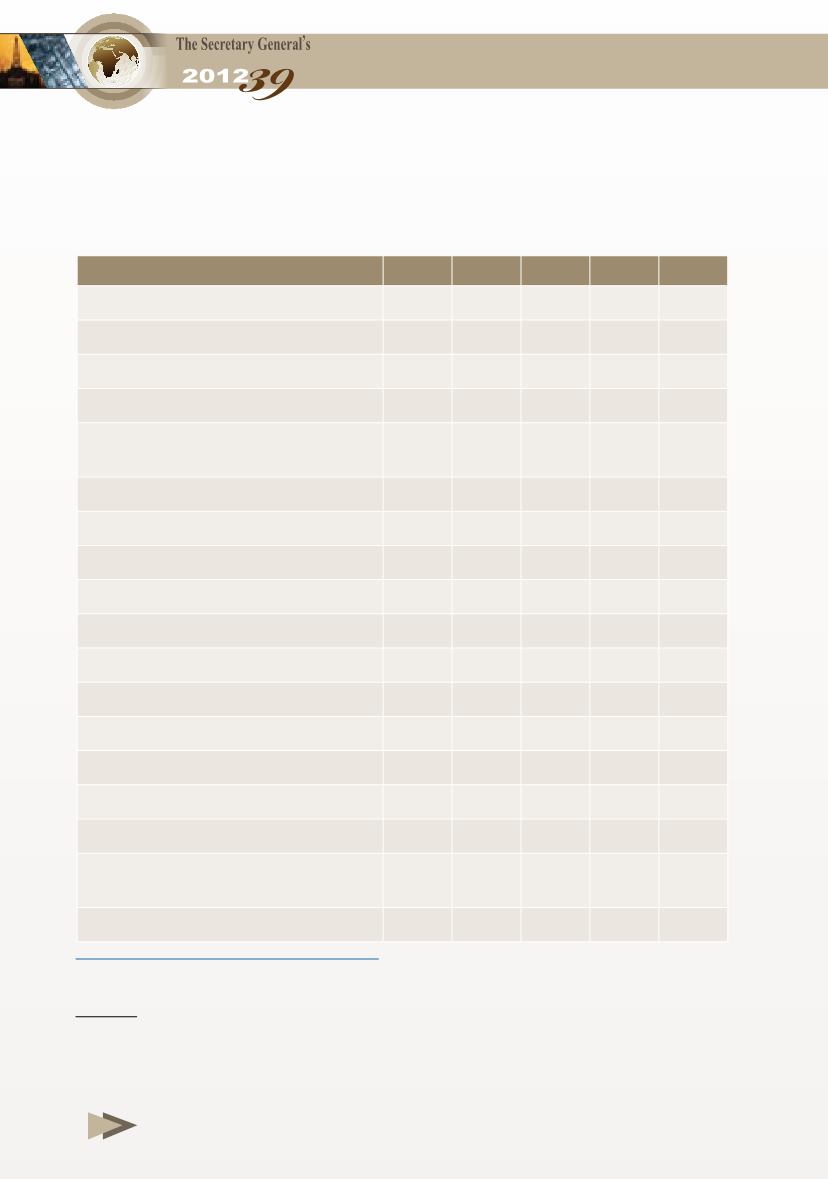
Total & Annual Change in Rest of the World Oil Demand
(Excluding Countries that joined the OECD), 2008-2012
(Million b/d)
2008 2009 2010 2011 2012*
Developing countries
33.6 34.4 36.1 37.2 38.2
Arab countries
5.4 6.2 6.5 6.3 6.6
Of which: Member countries
4.7 5.4 5.6 5.4 5.7
Other Arab countries 0.7 0.8 0.9 0.9 0.9
Other countries in the Middle
East and Africa
4.7 4.1 4.2 4.6 4.6
Total Middle East and Africa
10.1 10.3 10.7 10.9 11.2
Asian developing countries
17.6 18.2 19.1 19.9 20.5
Of which: China
8.0 8.3 9.0 9.4 9.7
India
3.1 3.2 3.4 3.5 3.7
Other countries
6.5 6.7 6.7 7.0 7.1
Latin America
5.8 5.7 6.2 6.4 6.5
Of which: Brazil
2.5 2.5 2.8 2.9 3.0
Other countries
3.3 3.2 3.4 3.5 3.5
Countries in transition (CIS)
4.9 4.7 4.9 5.0 5.1
Of which: Russia
4.1 4.0 4.2 4.3 4.4
Total Rest of the World
38.5 39.1 40.9 42.1 43.3
Annual Change in demand of
Rest of the World
1.3 0.6 1.8 1.2 1.2
Change (%)
3.5 1.6 4.6 2.9 2.9
* Estimated data.
Sources:
- IEA, Oil Market Report (various issues).
- OAPEC - Economics Department.
- OPEC, Monthly Oil Market Report (various issues).


