100
39
th
Annual Report
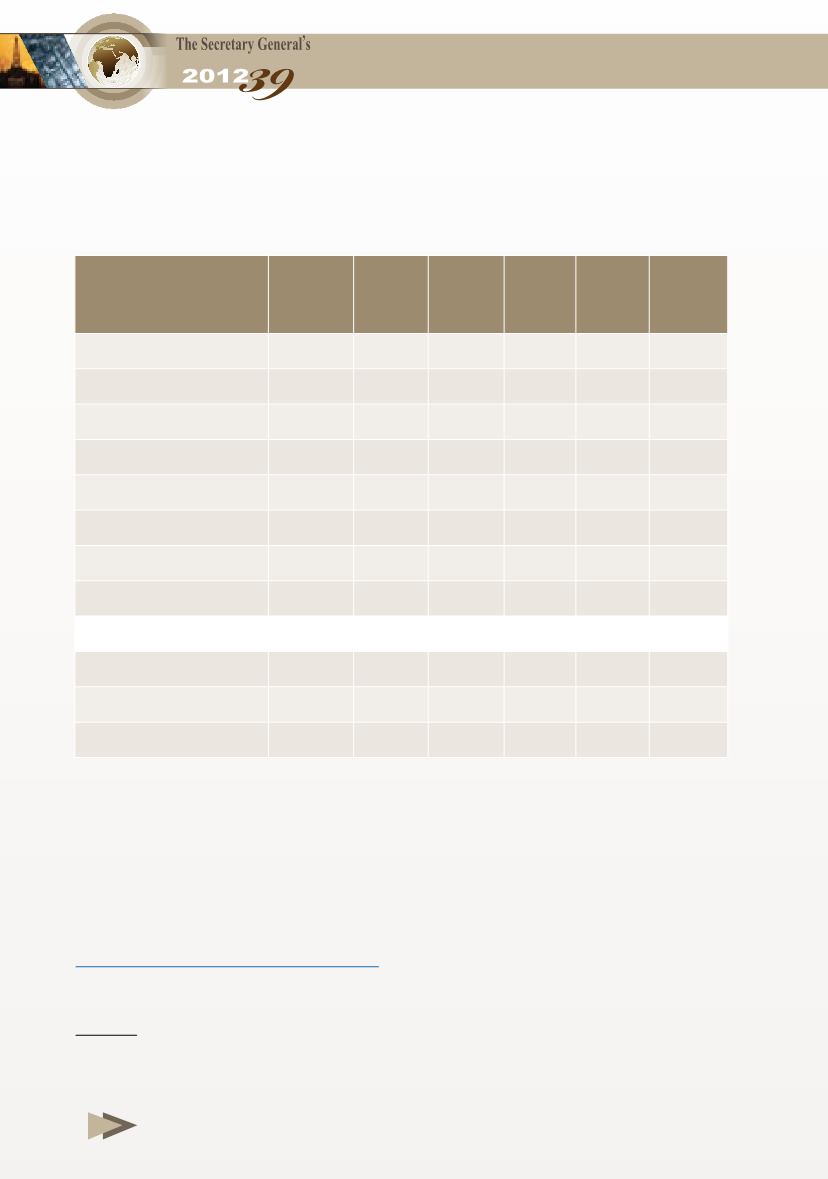
Crudes
2008 2009 2010 2011 2012
The
increase
in 2012
OPEC Basket Of which:
94.4
61.0 77.4 107.5 109.5 2.0
Algeria - Saharan Blend
98.9
62.4 80.4 112.9 111.7 (1.2)
Arabian Light
95.2
61.4 77.8 107.8 110.4 2.6
UAE - Murban
99.0
63.8 79.9 109.8 112.1 2.3
Kuwait - Export
91.2
60.7 76.3 105.6 109.2 3.6
Libya - Es Sider
96.7
61.5 79.1 111.9 112.1 0.2
Qatar-Marine
94.9
62.4 78.2 106.5 109.6 3.1
Iraq-Basrah
92.1
60.5 76.8 106.2 108.3 2.1
Other crudes
Brent
97.4
61.7 79.6 111.3 111.9 0.6
UAE - Dubai
93.8
61.8 78.1 106.2 109.4 3.2
WTI
100.0 61.9 79.4 94.9 94.7 (0.2)
Table 1-9
Average Spot Prices of the OPEC Basket,Brent,WTI and
Selected Arab Crudes, 2008-2012
($/barrel)
Note: Parentheses denote negative figures.
Sources:
- OAPEC - Economics Department.
- OPEC, Monthly Oil Market Report (various issues).


