106
39
th
Annual Report
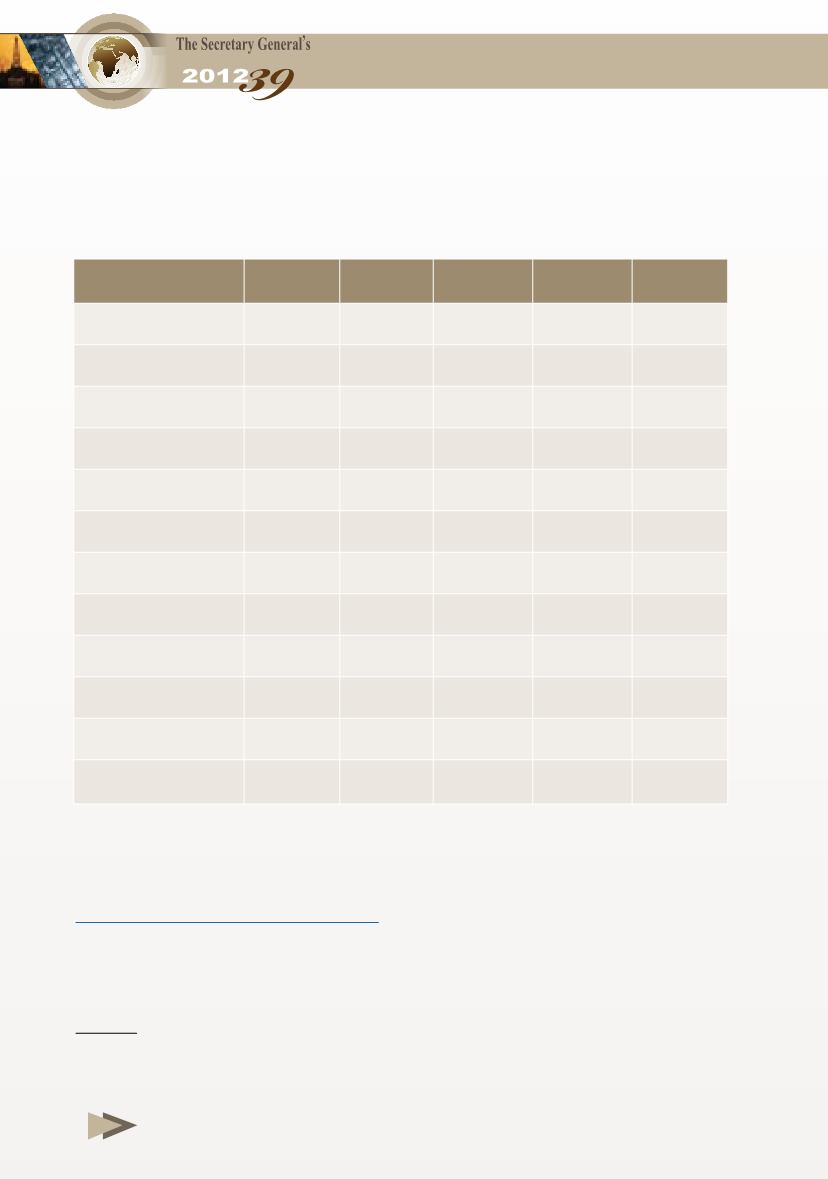
Table 1-15
Value of Oil Exports in OAPEC Member Countries,
2008-2012
($ Million)
* Estimated data.
** Preliminary data indicate that oil consumption exceeds oil production.
*** Official sources for 2008.
Sources:
- OAPEC - Economics Department.
- OPEC, Monthly Oil Market Report (various issues).
2008 2009* 2010* 2011* 2012*
Algeria
38543 21497 28089 37289 34662
Bahrain
5895
3275
4664
6305
7269
Egypt***
4911
2166
2593
4689
4770
Iraq
63000 43895 54248 83768 92685
Kuwait
57690 41858 53029 79646 99735
Libya
52084 29446 38764
7391
41705
Qatar
27428 16172 20553 27328 21014
Saudi Arabia
247097 144249 184421 289518 307119
Syria
7989
5414
6689
2994
**
Tunisia
**
**
**
**
**
UAE
80635 44785 57900 85900 93613
Total
585272 352757 450950 624828 702572


