
البحـث الثاني
135
2016
أوابك العلمية لعام
�
ص لبحوث العلمية الفائزة بجائزة
�
عدد خا
مجلة النفط والتعاون العربي
161
العدد
- 2017
أربعون
المجلد الثالث و ال
Re-refining of Used Lubricating Oil and its Economic and Environmental Implications
12
It can be stated that in the present situation, the re-refined base oil output in the Arab
countries is insignificant and that there is a great potential for growth in the re-refining
industry. Both the percentage of used lube oil that is collectable and the percentage that
is actually collected can be improved. Improvement can only be achieved through the
implementation and enforcement of appropriate measures including an efficient
collecting system, a state financial support through taxes and levies and regulations to
encourage investment in re-refining.
3.2.2 Used lubricating oil generated worldwide
The global lubricant consumption stood at 39.4 million metric tons in 2014 (Kline, 2015).
Assuming that 50% of the global consumption is lost due to evaporation, leakages,
spills, and other factors, a maximum of 19.7 million metric tons is available for
collection. According to Kline (2014), about 74% are collected and only 16% of collected
used oil is re-refined into base oils, 78% is burned as fuel and 6% disposed of.
In other
words, of the total used oil collected, only about 2.3 million tons is sent for re-refining.
This represents only 16% of used oil collected, 11.8% of collectable used oil and 6% of
global consumption.
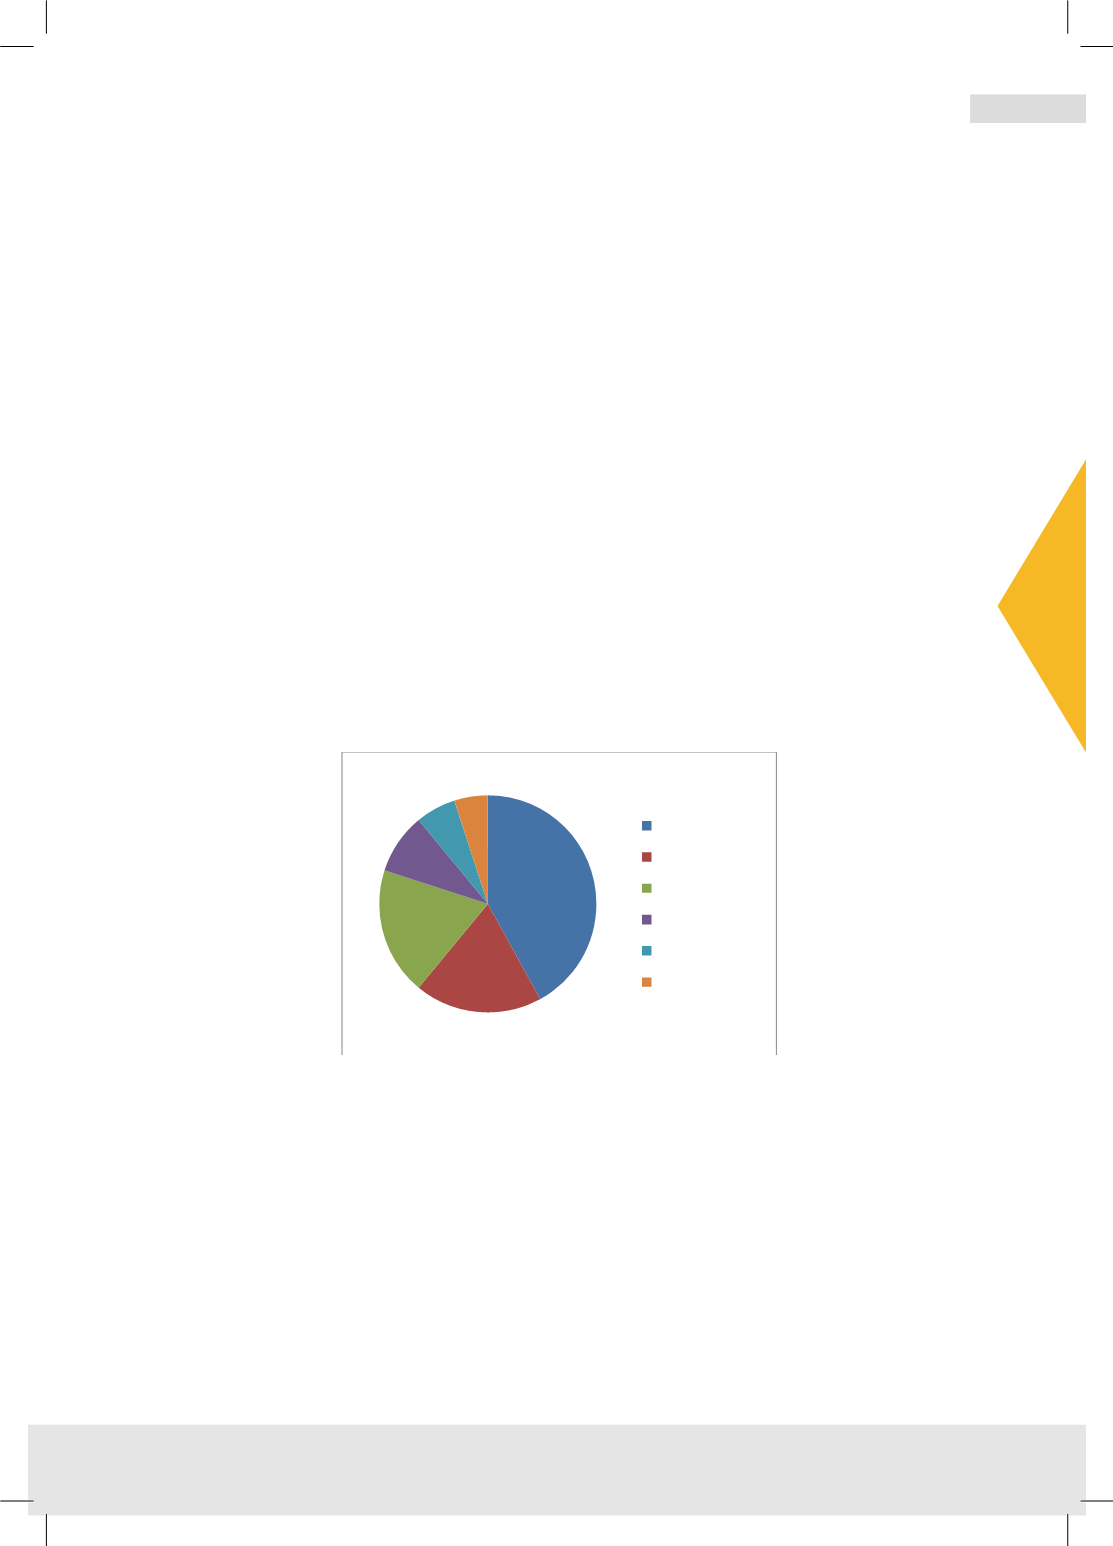
Figure 4 illustrates the global lubricant consumption breakdown by regions.
Figure 4 Global Lubricant consumption by region during 2014
Source
: Statista (2015)
Asia-pacific is the largest lubricant consuming region accounting for 42% of global
demand. About 7.9 million metric tons are generated annually. Of which, 5.6 million
metric tons are collected. Only 8% (445000 tons) are re-refined (Kline, 2010).
42%
19%
19%
9%
6%
5%
Asia_Pacific
North America
Europe
Latin America
Africa
Middle East


