202
39
th
Annual Report
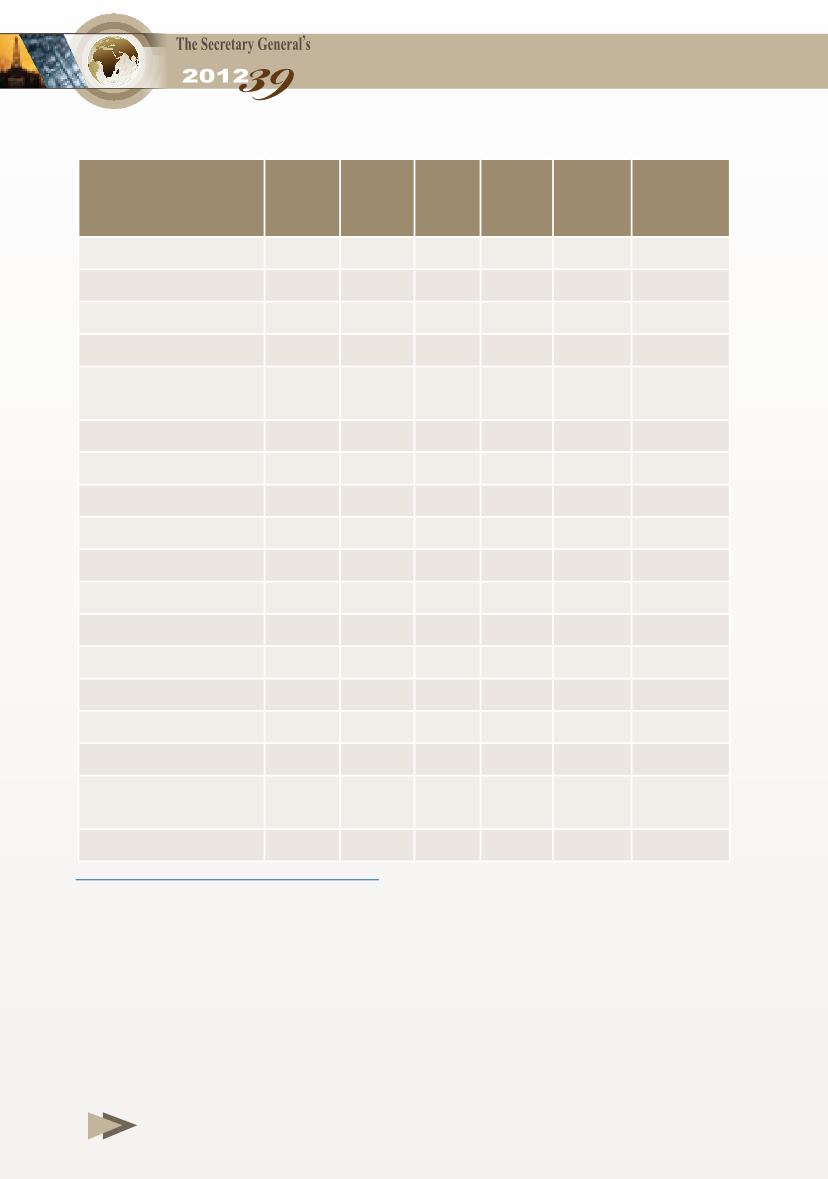
Table 2-5 Cont.
* Preliminary estimates.
Notes: Parentheses denote negative figures.
- Indonesia’s oil reserves are not included in OPEC figures.
Sources:
- Oil & Gas Journal, 1 Jan. 2013.
- OPEC Annual Statistical Bulletin, 2012.
2008 2009 2010 2011 2012*
(%)
Change
2012/2011
Brazil
365
364 366 417
396
(5.2)
Canada
1640
1754
1754
1727
1930
11.7
China
2265
3036
3036
3036
3524
16.1
CIS
56458
61301 61301 61301
61675
0.6
Of which:
Azerbaijan
850
850
850
850
991
16.6
Kazakhstan
2407
2407
2407
2407
2407
(0.0)
Russian Federation 47573
47573 47573 47573
47805
0.5
Turkmenistan
2662
7504
7504
7504
7504
0.0
Uzbekistan
1841
1841
1841
1841
1841
(0.0)
Mexico
373
360
339
490
488
(0.5)
Norway
2313
2313
2039
2007
2070
3.1
UK
343
292
256
253
246
(2.8)
USA
6732
6928
6928
7717
7717
0.0
Rest of the world 11475
17095 17160 15786
15079
(4.5)
World total
176362 188254 191893 191042 192367
0.7
OAPEC/world (%)
29.9 28.2 27.7 27.6 27.6
Arab countries/
world (%)
30.8 29.0 28.5 28.4 28.4
OPEC/world (%)
51.2 48.2 49.1 49.4 49.4


