204
39
th
Annual Report
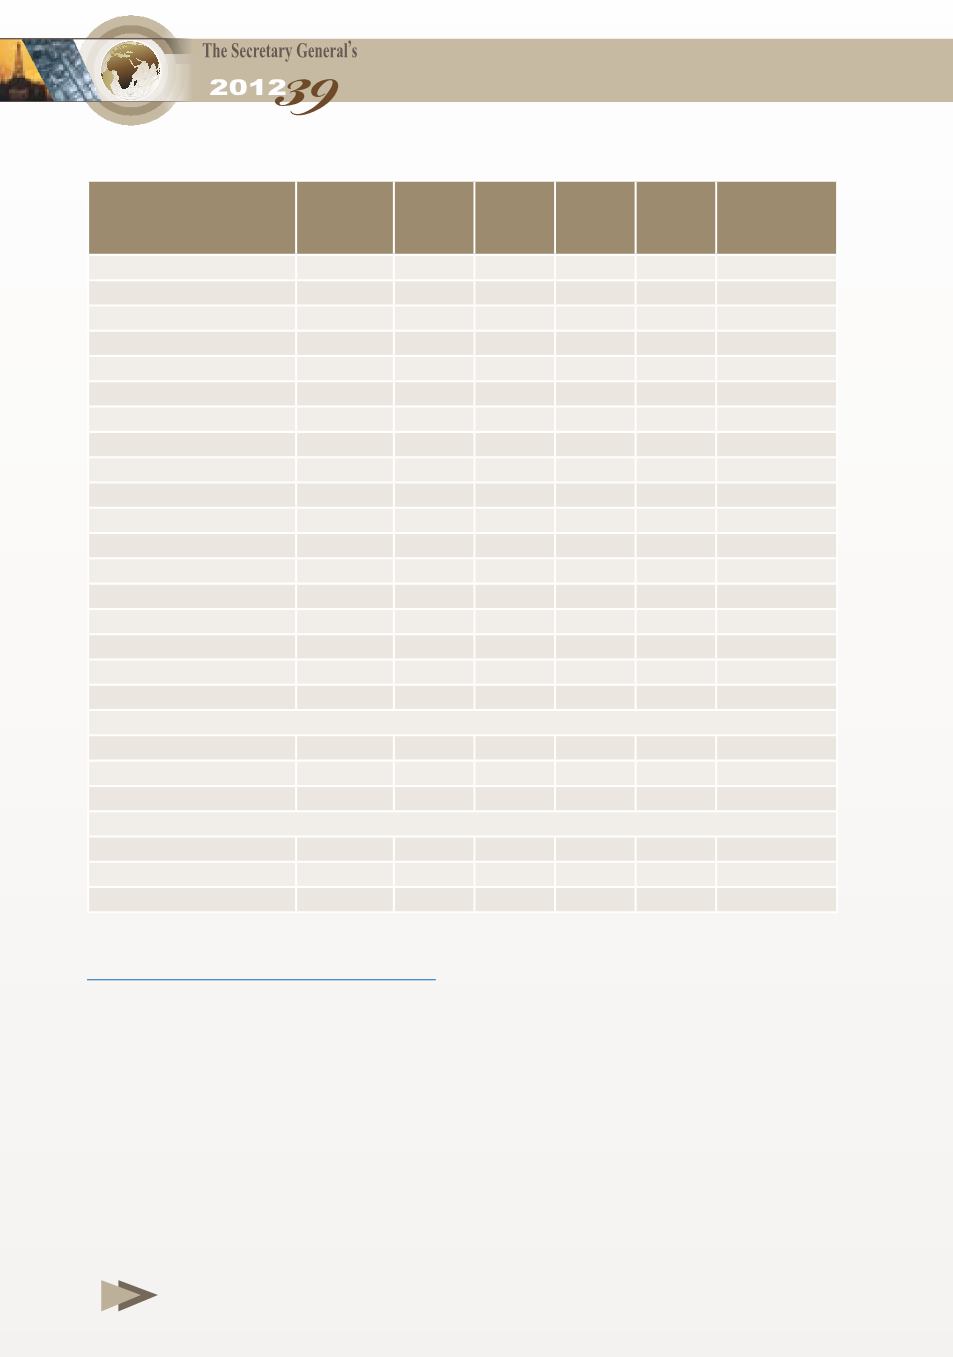
Table 2-6 Cont.
* Preliminary estimates.
** Official sources.
^ Five month average, Jan. - May 2012
Notes:
- Parentheses denote negative figures.
- 50% of the Divided Zone’s oil production is added to each of Saudi Arabia and Kuwait oil
production.
- Indonesia’s production is not included in OPEC figures.
Sources:
- Oil & Gas Journal, 1 Jan. 2013.
- OPEC Annual Statistical Bulletin 2012
- JODI Data Initiative
2008
2009 2010 2011 2012*
(%)
Change
2012/2011
Brazil
1810.1 1957.0 2049.7 2094.0 2017.5
(3.7)
Canada
2164.0
2034.0 2016.8 2082.8 2272.1
9.1
China
3802.8
3802.0 4049.0 4090.2 4228.1
3.4
CIS
12429.5 12661.0 13220.5 13264.5 12792.0
(3.6)
Of which: Azerbaijan
914.1
1014.0 1027.4
931.0
861.3
(7.5)
Kazakhstan
1385.0
1285.8 1600.0 1600.0 1559.5
(2.5)
Russian Federation
9768.4
9919.3 10147.6 10325.0 9935.0
(3.8)
Turkmenistan
220.0
220.0
220.0
220.0
215.4
(2.1)
Uzbekistan
105.0
85.0
87.0
86.0
70.0
(18.6)
Mexico
2807.7
2620.7 2594.3 2561.3 2549.0
(0.5)
Norway
2020.0
2017.0 1875.0 1739.4 1491.2
(14.3)
UK
1343.6
1292.7 1196.2
993.6
695.3
(30.0)
USA
4940.2
5309.0 5486.0 5642.5 6633.8
17.6
Rest of the world
18553.1
7613.0 7431.4 6986.0 7148.7
2.3
World Oil Production
84049.2 71066.0 71810.4 72204.8 75302.9
4.3
OAPEC/world (%)
25.2
27.7 27.5 29.1 30.3
Arab countries/world (%)
26.9
29.7 29.6 31.1 32.3
OPEC/world (%)
37.6
40.9 40.6 41.6 43.7
Second : Natural Gas Liquids Production
OAPEC Members
3314.2
2698.4 2857.0 2814.1 2814.1
Arab countries
3412.2
2818.4 2982.0 2939.1
World
9223.0
8980.0 8093.0 7489.0 7489.0
Third : Total Hydrocarbon Liquids Production
World Total
93272.2 80046.0 79903.4 79693.8 82791.9
OAPEC/world (%)
26.2
27.9 28.3 29.9
Arab Countries/ world (%)
27.9
29.9 30.4 31.9


