209
Tables Chapter TWO
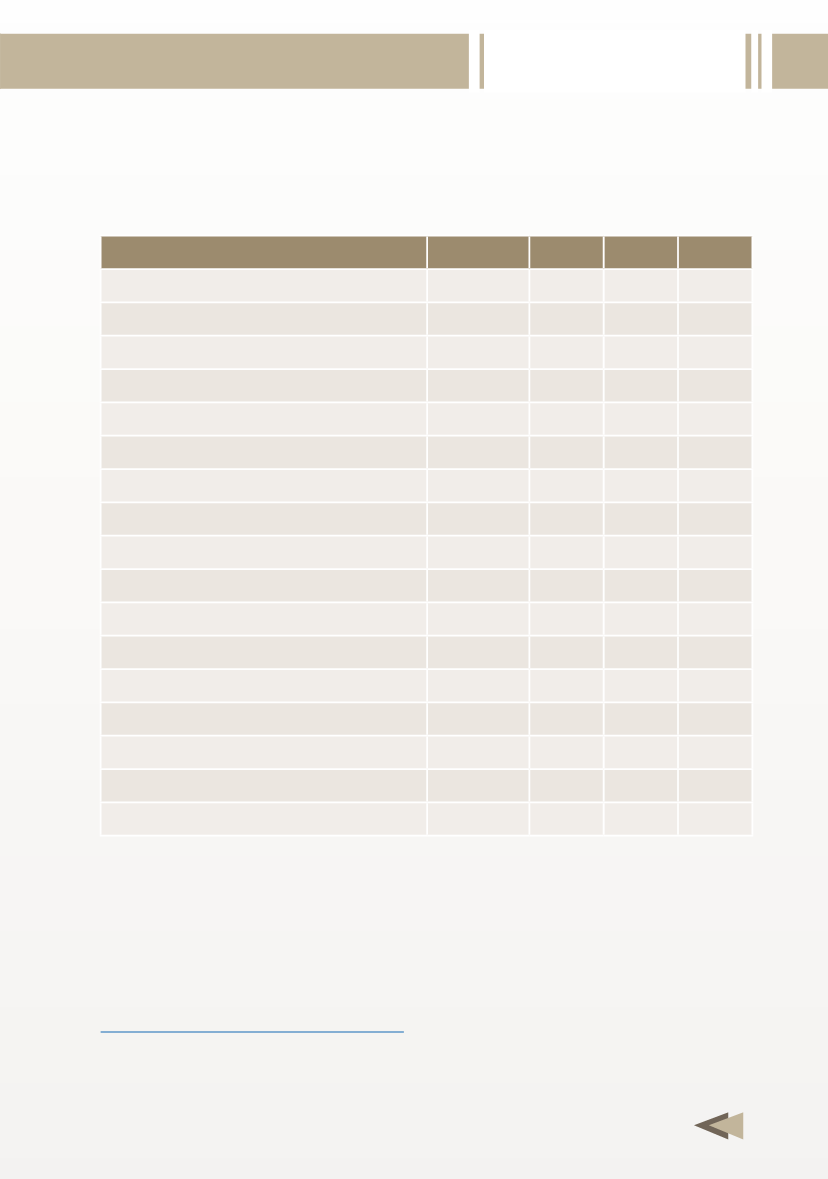
Table 2-10
World Coal Production, 2008 - 2011
(Million tons/year)
Source:
- BP Statistical Review of World Energy, June 2009 , June 2010 , June 2011 and June 2012.
2008 2009 2010 2011
North America
1131.4
1038.5 1052.5 1060.9
Canada
68.4
63.3
67.9
68.2
USA
1063.0
975.2 984.6 992.8
Central & South America
98.4
92.9
96.5
117
Of which: Brazil
6.6
5.1
5.5
6.2
Colombia
73.5
72.8
74.4
85.8
Mexico
11.5
10.5
9.3
15.7
Europe
1250.9
1163.2 1194.3 1256.8
Of which: FSU
519.2
476.1 501.0 536.2
Asia/Oceania
4076.6
4331.1 4683.5 5000.1
Of which: Australia
399.2
413.2 423.9 415.5
China
2802.0
2973.0 3240.0 3520
India
515.9
556.0 569.9 588.5
Africa
255.7
253.6 256.9 259.5
Of which: South Africa
252.6
250.6 253.8 255.1
Middle East
1.6
1.2
1.2
1.2
World total
6822.1
6904.6 7254.6 7695.4


