207
Tables Chapter TWO
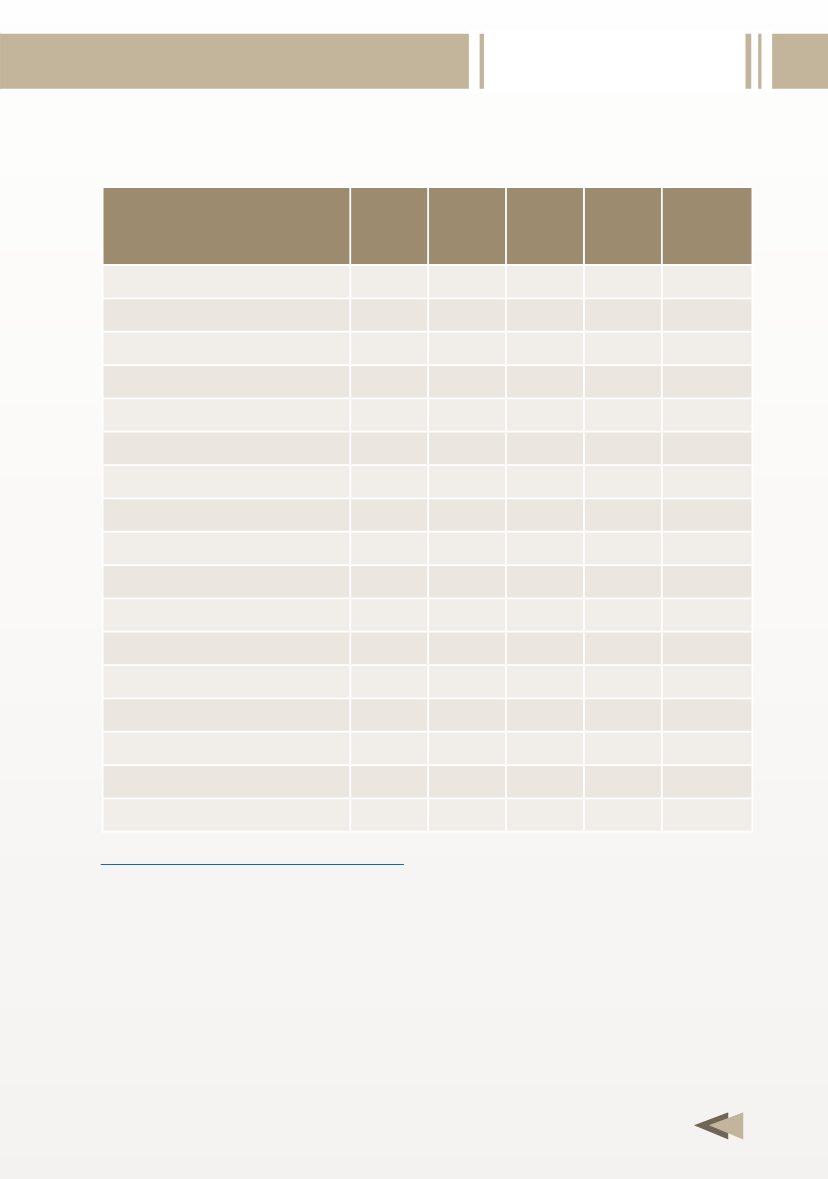
Table 2-8 Cont.
* Preliminary estimates.
** Official sources.
Notes:
- Parentheses denote negative figures.
- Indonesia’s production is not included in OPEC figures.
Sources:
- OPEC Annual Statistical Bulletin 2012.
- BP Statistical review of world energy full report 2012.
2008 2009 2010 2011*
(%)
Change
2011/2010
Canada
173400 161400 159800 160500 0.4
China
80300 85200 94800 102500 8.1
CIS
827300 719100 784780 785500 0.1
Of which: Azerbaijan 11000 14900 15100 14800 (2.0)
Kazakhstan
18700 17800 17600 19300 9.7
Russian Federation
601700 527500 588900 607000 3.1
Turkmenistan
66100 36400 42400 59500 40.3
Uzbekistan
62200 64400 59100 57000 (3.6)
Mexico
54000 58200 55278 52500 (5.0)
Norway
99200 103500 106350 101400 (4.7)
UK
69600 59600 57100 45200 (20.8)
USA
574400 593400 604100 651300 7.8
Rest of the world
578950 552826 641321 616241 (3.9)
World total
3060700 3029501 3297916 3338071 1.2
OAPEC/world (%)
13.3 15.0 16.1 16.2
Arab countries/world (%) 14.1 15.8 16.9 17.1
OPEC/world (%)
16.2 19.5 20.8 21.3


