205
Tables Chapter TWO
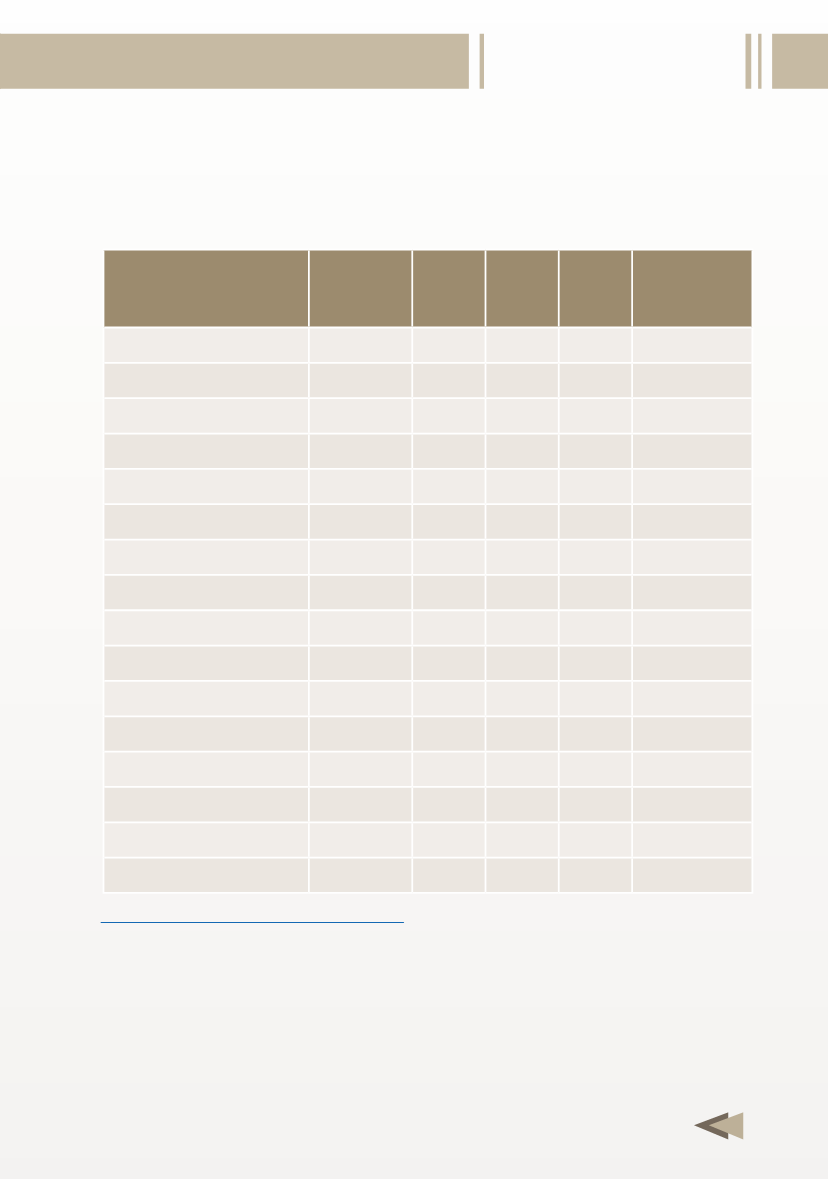
Table 2-7
NGL Production in OAPEC Members and other Arab Countries,
2008 - 2011
(Thousand b/d)
Note:
* 2011 data are of official sources except for Syria and Yemen
Sources:
- Oil & Energy Trends, Annual Statistical Review, 2012.
2008 2009 2010 2011
(%)
Change
2011/2010
Algeria
1100
572
514
486.0
(5.4)
Bahrain
10
10
10
11.0
10.0
Egypt
164
158
158
109.0
(31.0)
Iraq
30
41
44
45.0
2.3
Kuwait
30
40
40
30.0
(25.0)
Libya
86
84
70
19.1
(72.7)
Qatar
200
636
835
1001.0
19.9
Saudi Arabia
1434
897
962
1009.0
4.9
Syria
10
10
10
10.0
0.0
UAE
250
250
214
94.0
(56.1)
Total OAPEC
3314 2698 2857 2814
(1.5)
Oman
88
100
105
105.0
0.0
Yemen
10
20
20
20.0
0.0
Total Arab countries
3412 2818 2982 2939
(1.4)
World total
9223 8980 8093 7489
(7.5)
OAPEC/world (%)
35.9
30.1 35.3 37.6


