228
39
th
Annual Report
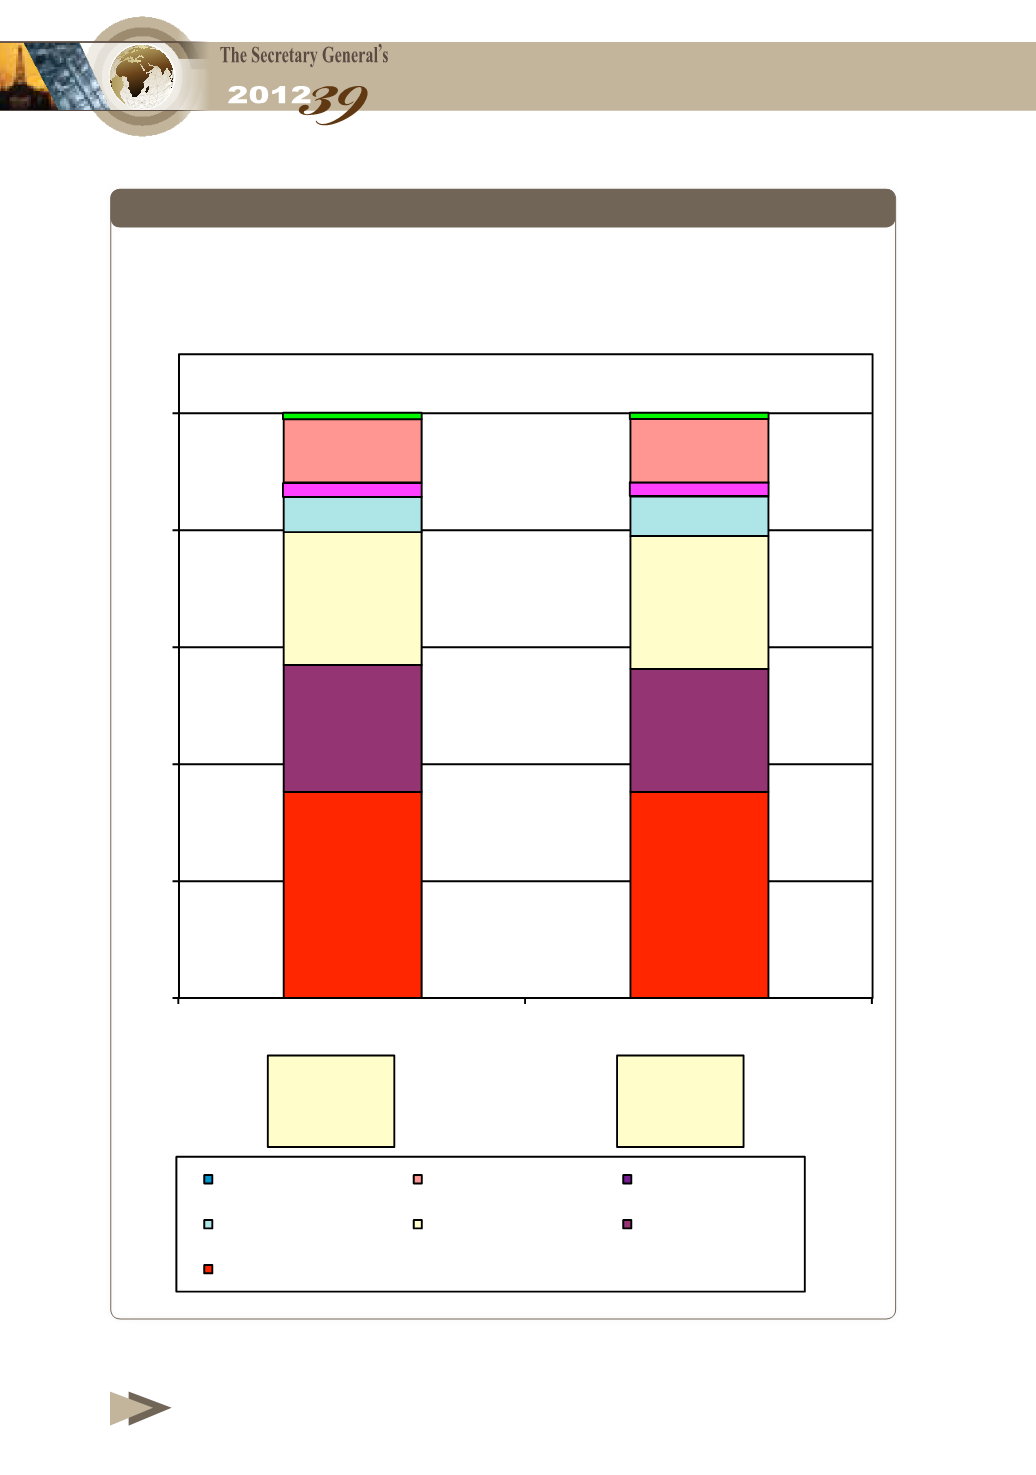
Figure 3-6
World Hydrocracking Capacity by Region,
End of 2011 and 2012
(%)
35.3%
35.1%
21.5%
21.2%
22.8%
22.5%
6.0%
7.0%
2.4%
2.3%
10.9%
10.8%
1.1%
1.1%
0%
20%
40%
60%
80%
100%
2011
2012
World total
5.49
Million b/d
World total
5.56
Million b/d
Africa
Middle East
South America
Eastern Europe/CIS
Asia/Pacific
Western Europe
North America


