230
39
th
Annual Report
or 0.64% and in Eastern Europe with 30,000 b/d, or 0.63% compared
with its level in 2011.
Table (3-5)
,
Figure (3-8)
.
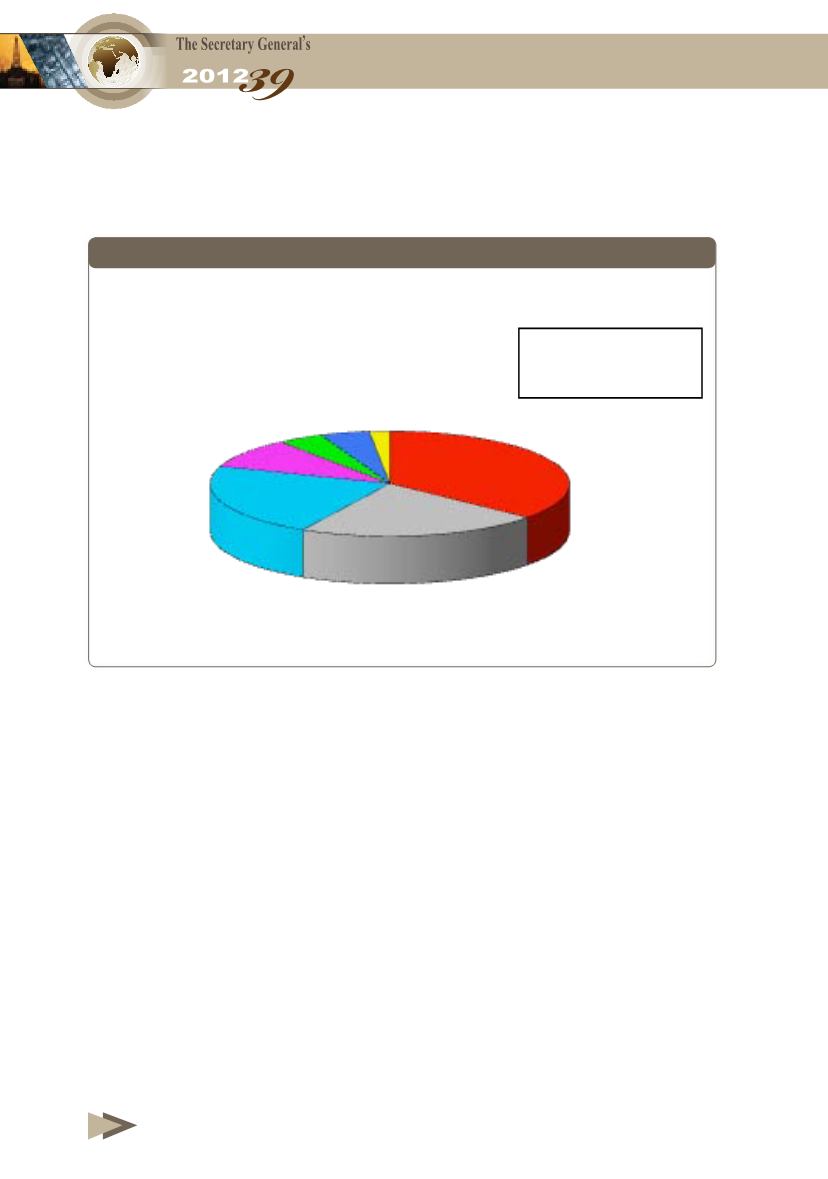
Figure 3-8
Distribution of Hydrotreating Capacity by Region, End, 2012
Table (3-6)
lists the top 25 refining companies that own most of the
refinery capacity in the world. The table includes also partial interest
in refineries that the company do not wholly own.
Major changes in positions are few: Chevron and Phillips swapped
ranks as well as Marathon and OAO Lukoil.
Table (3-7)
lists the world’s largest refineries with a minimum
capacity of 400,000 b/d at the end of 2012. S-Oil Corp.’s refinery
moved up to the 4th class as a result of raising its refining capacity
from 564,000 b/d to 669,000 b/d. Also Marathon Petroleum Co.
moved up from the 13
th
class to 11
th
after raising its refining capacity
from 490,000 b/d to 522,000 b/d.
North America
%36.2
Western Europe
%21.8
Asia/Pacific
%22.3
Eastern Europe/
CIS
%9.3
South America
%4.1
Middle East
%4.4
Africa
%1.8
45.85
Million b/d


