92
39
th
Annual Report
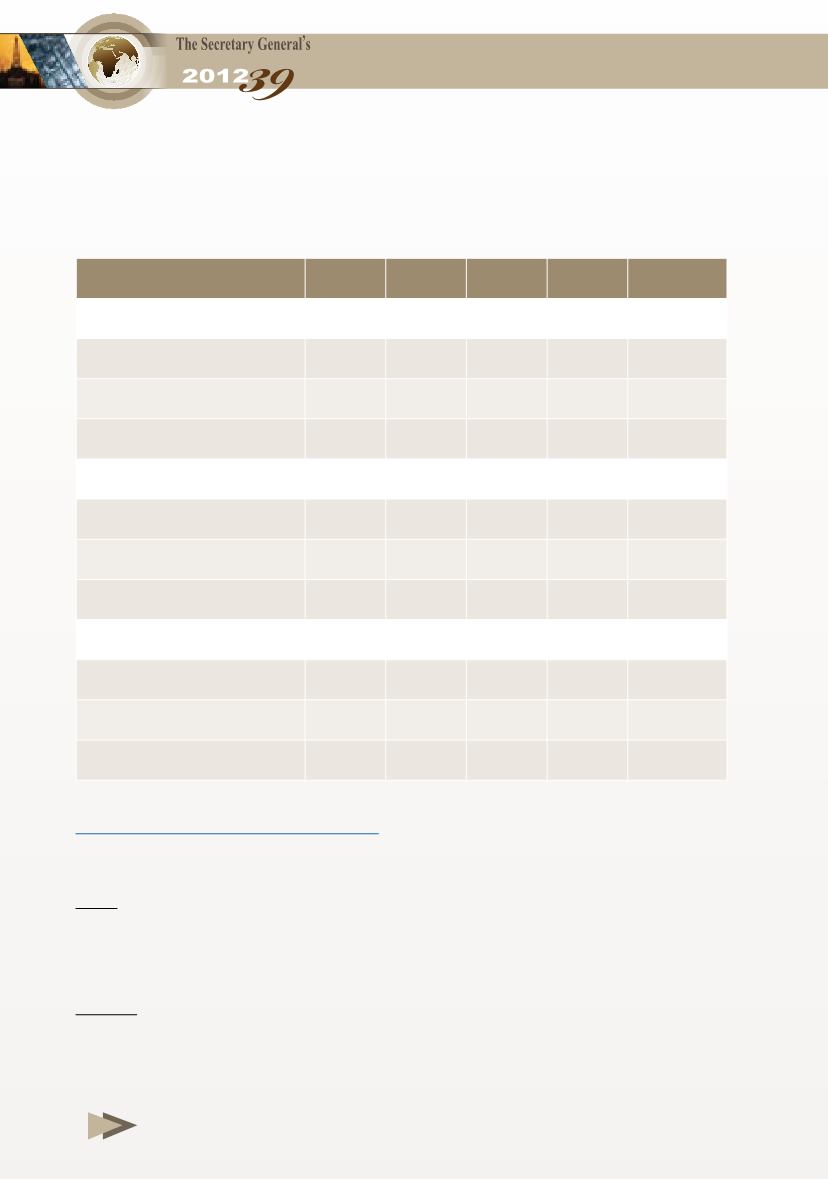
Table 1-1
Total & Annual Changes in World Oil and NGLs Supply,
2008 - 2012
(Million b/d)
2008 2009 2010 2011 2012*
Total Supply
OPEC
35.3 33.0 34.2 35.2
37.0
Rest of the World
50.4 51.1 52.3 52.4
53.0
World total
85.7 84.1 86.5 87.6
90.0
Annual Change
OPEC
1.2
)2.3(
1.2
1.0
1.8
Rest of the World
)0.1(
0.7
1.2
0.1
0.6
World total
1.1
)1.6(
2.4
1.1
2.4
Percentage Change (%)
OPEC
3.5
)6.5(
3.6
2.9
5.1
Rest of the World
)0.2(
1.4
2.3
0.2
1.1
World total
1.3
)1.9(
2.8
1.3
2.7
* Estimated data.
Notes:
- Parentheses denote negative figures.
- OPEC’s supply includes data from both Angola and Ecuador, which were admitted
to OPEC as a full member at the beginning and the end of year 2007 respectively.
Sources:
- IEA, Oil Market Report (various issues).
- OAPEC - Economics Department.
- OPEC, Monthly Oil Market Report (various issues).


