94
39
th
Annual Report
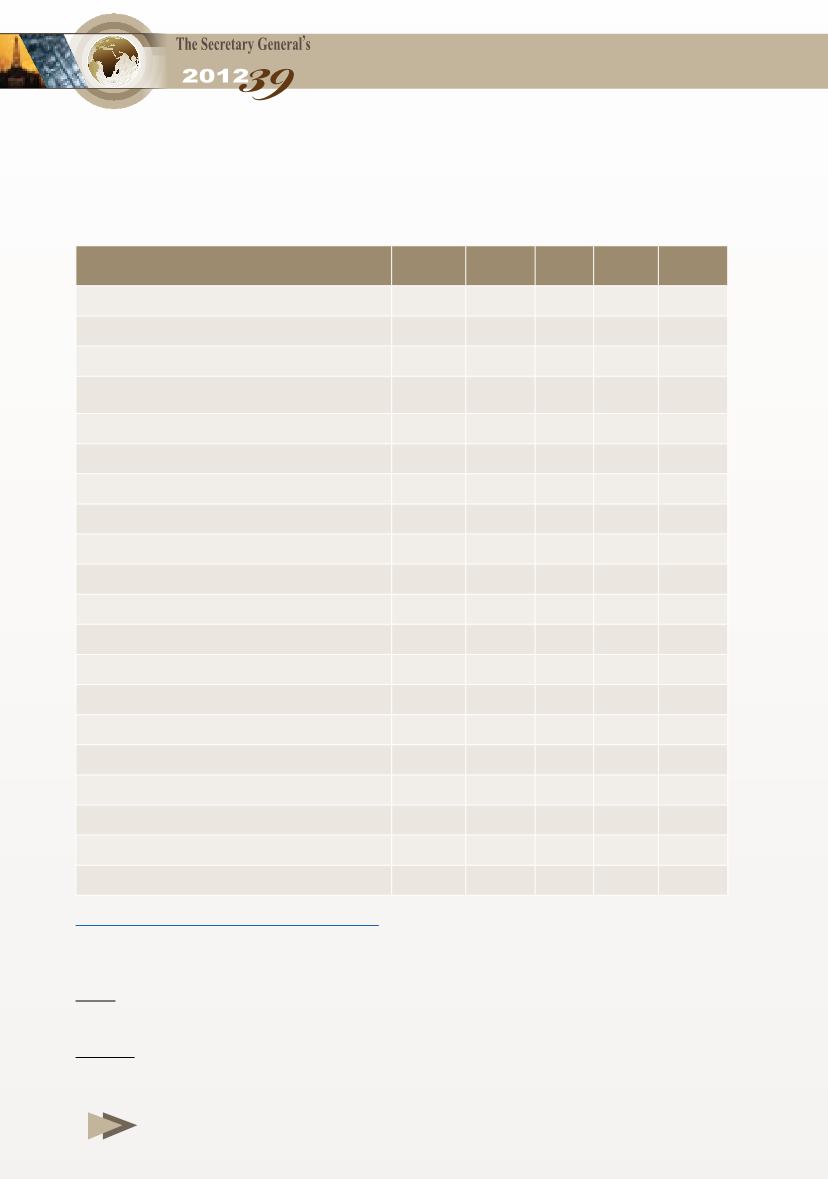
Table 1-3
World Economic Growth,
2008-2012
(%)
2008 2009 2010 2011 2012*
OECD
0.1 (3.5) 3.0 1.6 1.3
Of which: Euro Area
0.4 (4.4) 2.0 1.4 (0.4)
Japan
(1.0) (5.5) 4.5 (0.8)
2.2
Newly industrialized
Asian countries
1.8 (0.7) 8.5 4.0 2.1
USA
(0.3) (3.1) 2.4 1.8 2.2
Eastern and Central Europe
3.2 (3.6) 4.6 5.3 2.0
Countries in transition (CIS)
5.4 (6.4) 4.8 4.9 4.0
Of which: Russia
5.3 (7.8) 4.0 4.3 3.7
Asian developing countries
7.9 7.0 9.5 7.8 6.7
Of which: China
9.6 9.2 10.5 9.2 7.8
India
6.9 5.9 10.1 6.8 4.9
Latin America and the Caribbean
4.3 (1.6) 6.2 4.5 3.2
Of which: Argentina
6.8 0.9 9.2 8.9 2.6
Brazil
5.2 (0.3) 7.5 2.7 1.5
Mexico
1.2 (6.5) 5.6 3.9 3.8
Venezuela
5.3 (3.3) (1.5) 4.2 5.8
Middle East and North Africa
4.5 2.6 5.0 3.3 5.3
Sub-Saharan African countries
5.6 2.8 5.3 5.2 5.0
Rest of the World:
6.1 2.7 7.5 6.2 5.3
World
2.8 (0.6) 5.1 3.8 3.3
* Estimated data.
** Includes all of Hong Kong, South Korea, Singapore and Taiwan.
Note:
Parentheses denote negative figures.
Source:
- IMF, World Economic Outlook, October 2012.


