


 87 / 222

مجلة النفط والتعاون العربي
161
العدد
- 2017
أربعون
المجلد الثالث و ال
2016
أوابك العلمية لعام
�
ص لبحوث العلمية الفائزة بجائزة
�
عدد خا
80
70
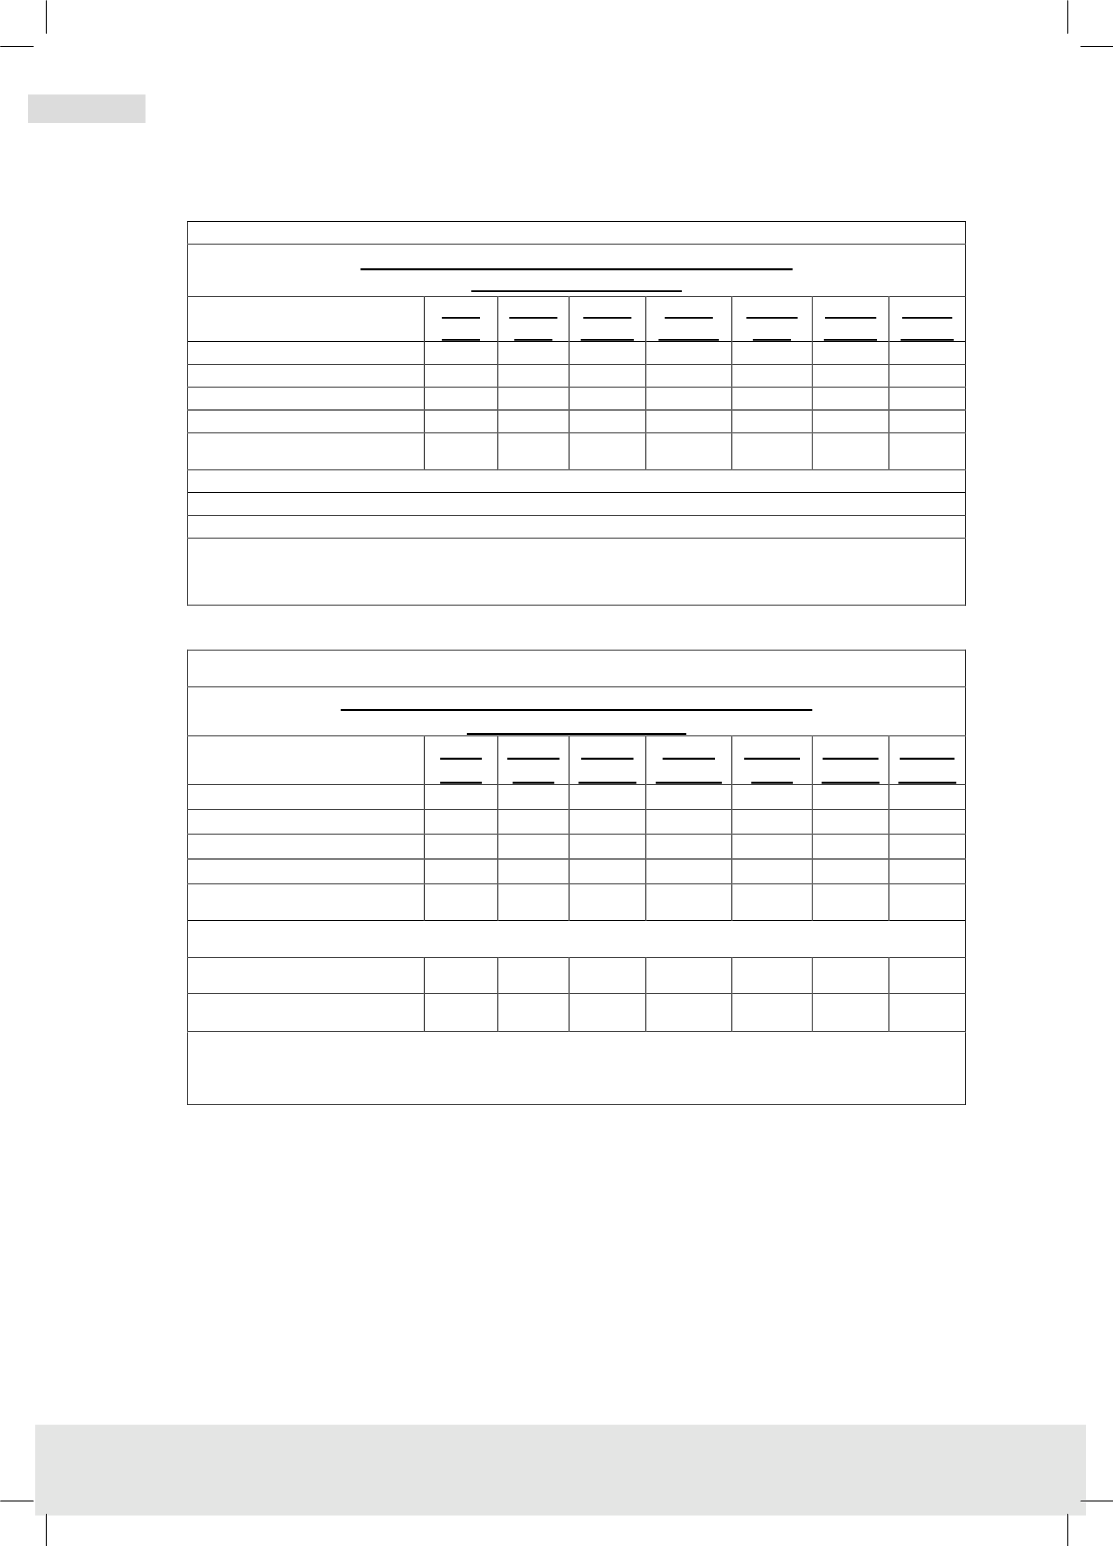
Table (14)
Derived Used Oil Fee Euro/ton for Various Processes
100 thousand tons/y Plant
Acid
Clay
TFE+
Clay
TFE+
Hydro
TFE+
Solvent
TDA+
Clay
TDA+
Hydro
PDA+
Hydro
Capacity 1000 ton/year
100
100
100
100
100
100
100
Capital cost million Euro
34
37
57
49
45
69
61
Operating Cost Euro/ton
152
165
214
202
280
304
248
Revenue Euro/ton
177
203
251
226
211
252
224
Used Oil Fee Euro/ton
-25
-37
-37
-24
69
52
24
TFE = Thin Film Evaporator
TDA = Thermal Deasphalting
PDA = propane Deaspahlting
Source: Adaptation from (1). Simple averages of cited plants in Europe. Based on GEIR,
CONCAWE & TN Sofres. Plants capacity has been normalized to 100 to make the comparison more
representative.
Table (15)
Derived Used Oil Fee Euro/ton for Various Processes
35 thousand tons/y Plant
Acid
Clay
TFE+
Clay
TFE+
Hydro
TFE+
Solvent
TDA+
Clay
TDA+
Hydro
PDA+
Hydro
Capacity 1000 ton/year
35
35
35
35
35
35
35
Capital cost million Euro
17
19
29
25
23
35
31
Operating Cost Euro/ton
244
265
343
323
449
399
399
Revenue Euro/ton
177
203
251
226
211
252
224
Used Oil Fee Euro/ton
67
63
92
98
238
52
175
Used Oil Fee Comparison of Two Capacities
Capacity 100
-25
-37
-37
-24
69
52
24
Capacity 35
67
63
92
98
238
147
175
Source: Adaptation from (1). Simple averages of cited plants in Europe. Based on GEIR,
CONCAWE & TN Sofres. Plants capacity has been normalized to 35 to make the
comparison more representative. The used oil fee is compared for two cases.
Comparison of the two cases reveals that all processes need subsidy when the
plant is of small capacity and that subsidies per ton of used oil feed increase when
the plant is smaller as displayed in Fig (22).